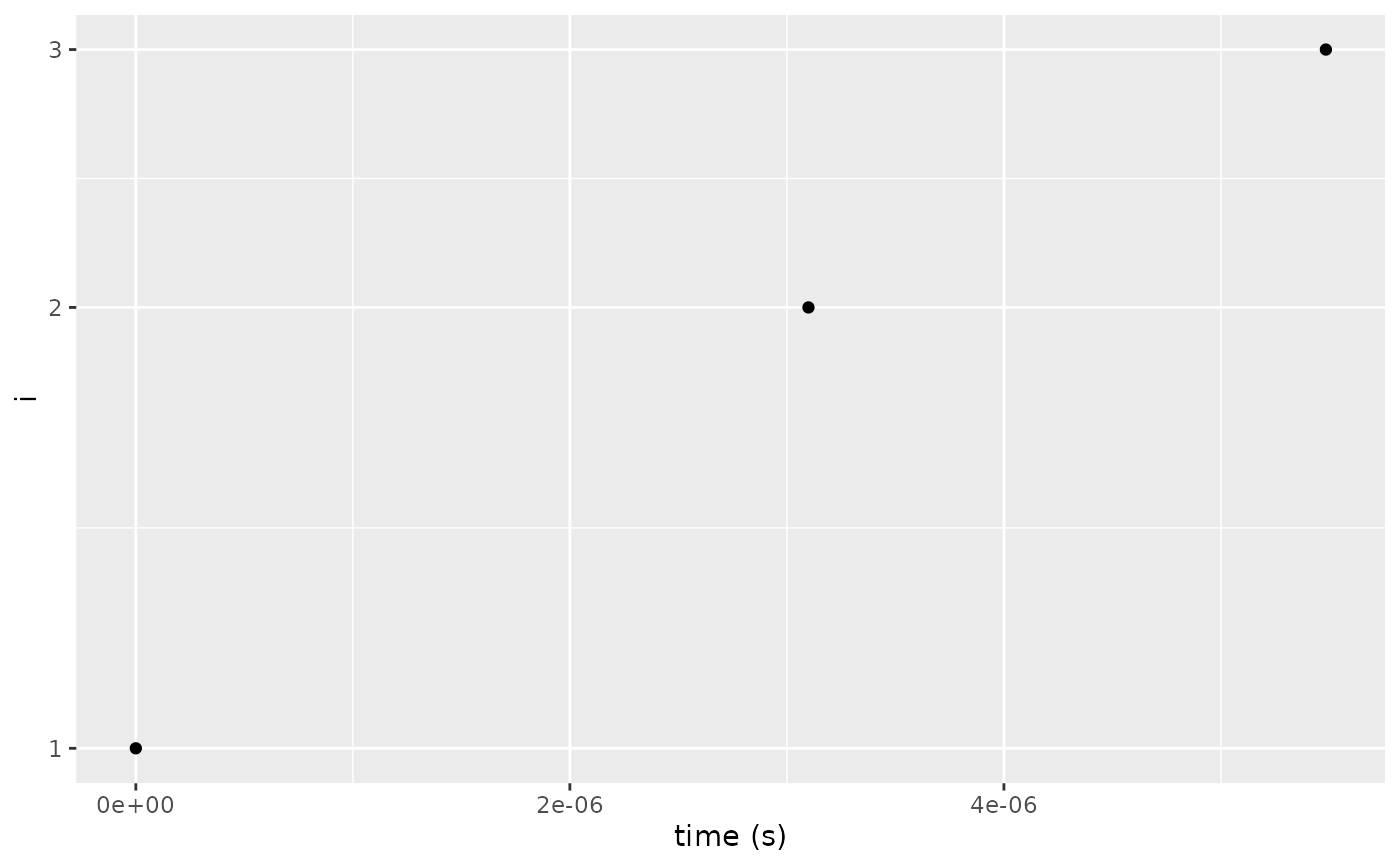
Plots the value of a traced object on a log-scale against runtime.
Usage
# S3 method for class 'tracer'
autoplot(object, y, ...)

# S3 method for class 'trace'
autoplot(object, y, log = TRUE, ...)
Arguments
- object
a trace or tracer object
- y
the name of the traced object to plot
- ...
additional arguments passed to
- log
logical. Should the y-axis be on a log-scale. Default is TRUE.
Examples
tr <- tracer("i", Delta = 0)

for (i in 1:3) {
  tr$tracer()
}

ggplot2::autoplot(tr, i)