Plot results from diagnostics collected during model fitting
Source:R/plotDiagnostics.R
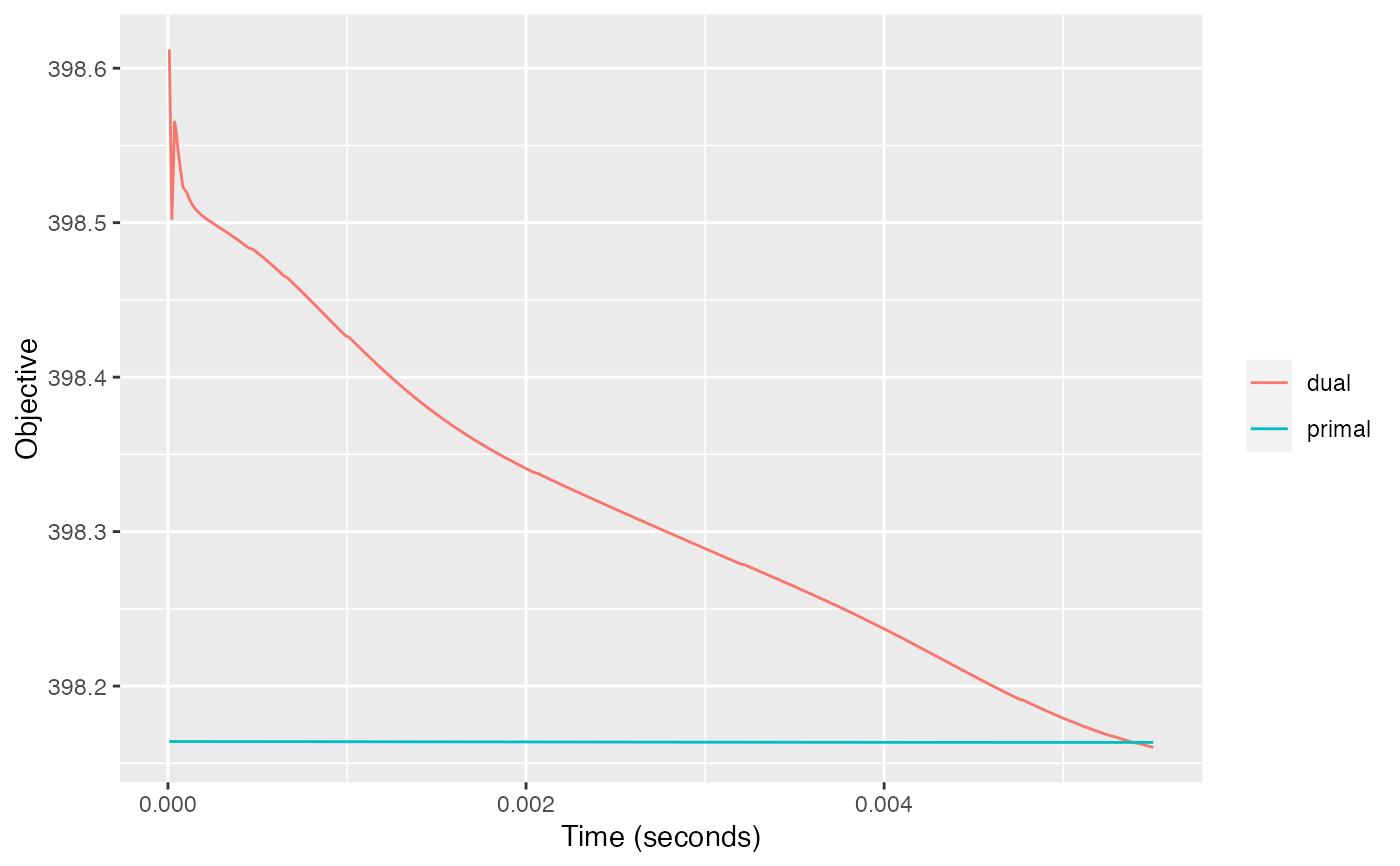
plotDiagnostics.RdThis function plots various diagnostics collected during
the model fitting resulting from a call to SLOPE() provided that
diagnostics = TRUE.
Arguments
- object
an object of class
"SLOPE".- ind
either "last"
- xvar
what to place on the x axis.
iterationplots each iteration,timeplots the wall-clock time.
Value
An object of class "ggplot", which will be plotted on the
current device unless stored in a variable.
See also
Examples
x <- SLOPE(abalone$x, abalone$y, diagnostics = TRUE)
plotDiagnostics(x)