Getting Started
This tutorial demonstrates the main features of qualpal for generating and working with color palettes.
Installation
Qualpal is on PyPi and can be installed via pip:
pip install qualpal
If you want visualization support (requires matplotlib), install with:
pip install qualpal[viz]
Generating Palettes
The main API entry point is the Qualpal class, which generates color palettes
through the generate method.
from qualpal import Qualpal

qp = Qualpal()

palette = qp.generate(6)
Here, we have generated a palette with 6 distinct colors. The palette class supports a rich HTML representation in Jupyter notebooks, so printing it will show the colors visually:
palette
Customizing the Color Space
By default, qualpal generates colors across the full HSL color space, but you can restrict the hue, saturation, and lightness ranges to create specific styles of palettes.
qp_pastel = Qualpal(
    colorspace={
        'h': (0, 360),   # Full hue range
        's': (0.3, 0.6), # Low saturation
        'l': (0.7, 0.9)  # High lightness
    }
)

qp_pastel.generate(5)
Or create a palette with only warm colors:
qp_warm = Qualpal(
    colorspace={
        'h': (-20, 60),
        's': (0.5, 1.0),
        'l': (0.4, 0.7)
    }
)

qp_warm.generate(5)
As you can see, negative hue values wrap around, so -20 corresponds to 340 degrees.
Alternative Inputs
Qualpal supports two other modes of input: a list of candidate colors to choose from or one of the built-in color palettes that are available. To use candidate colors, provide a list of hex color strings:
candidates = ["#e6194b", "#3cb44b", "#ffe119", "#4363d8",
              "#f58231", "#911eb4", "#46f0f0", "#f032e6",
              "#bcf60c", "#fabebe", "#008080", "#e6beff",
              "#9a6324", "#fffac8", "#800000", "#aaffc3",
              "#808000", "#ffd8b1", "#000075", "#808080"]

qp_candidates = Qualpal(colors=candidates)
qp_candidates.generate(3)
You can also use built-in palettes by name:
qp_builtin = Qualpal(palette="Tableau:10")
qp_builtin.generate(5)
For a list of available built-in palettes, you can call list_palettes(),
which returns a dictionary of palette names and their descriptions.
from qualpal import list_palettes, Palette

available_palettes = list_palettes()
available_palettes["Rembrandt"] # Example built-in palette
['AnatomyLesson', 'Staalmeesters']
from qualpal import get_palette

get_palette("Rembrandt:Staalmeesters")
As you can see from above, built-in palettes are
specified using the format Domain:Name, so that Rembrandt:Staalmeesters refers to the
“Staalmeesters” palette from the “Rembrandt” collection.
Working with Palettes
Palettes are represented by the Palette class, which supports indexing,
iteration, and length retrieval.
from qualpal import Palette

# Create palette from hex colors
pal = Palette(["#ff0000", "#00ff00", "#0000ff", "#ffff00"])

# Access colors by index
first_color = pal[0]
print(f"First color: {first_color.hex()}")

# Iterate over colors
print("\nAll colors:")
for i, color in enumerate(pal):
    print(f"  {i}: {color.hex()}")

# Get length
print(f"\nPalette size: {len(pal)}")
First color: #ff0000

All colors:
  0: #ff0000
  1: #00ff00
  2: #0000ff
  3: #ffff00

Palette size: 4
Indexing a single color returns a Color object, which supports various color operations.
Palette Analysis
Qualpal also provides methods to analyze palettes, such as measuring the perceptual distances between colors.
# Minimum pairwise distance
min_dist = pal.min_distance()
print(f"Minimum distance: {min_dist:.2f}")

# Distance to each nearest neighbor
min_dists = pal.min_distances()
print(f"Distances: {[f'{d:.2f}' for d in min_dists]}")

# Full distance matrix
matrix = pal.distance_matrix()
print(f"\nDistance matrix shape: {len(matrix)}x{len(matrix[0])}")
print(f"Distance from color 0 to color 1: {matrix[0][1]:.2f}")

matrix
Minimum distance: 23.40
Distances: ['52.88', '23.40', '52.88', '23.40']

Distance matrix shape: 4x4
Distance from color 0 to color 1: 86.61
[[0.0, 86.60823745353736, 52.88136803127366, 64.30086090099867],
 [86.60823745353736, 0.0, 83.18587765548577, 23.404244339728105],
 [52.88136803127366, 83.18587765548577, 0.0, 103.4269788927728],
 [64.30086090099867, 23.404244339728105, 103.4269788927728, 0.0]]
Exporting Palettes
Qualpal supports exporting palettes in various formats. For example, CSS variables:
pal.to_css(prefix="brand")
['--brand-1: #ff0000;',
 '--brand-2: #00ff00;',
 '--brand-3: #0000ff;',
 '--brand-4: #ffff00;']
There is also support for JSON export:
import json
json_str = pal.to_json()
print(f"JSON: {json_str}")

# Can be used in configs
config = {
    "theme": {
        "colors": json.loads(json_str)
    }
}
print(f"\nConfig: {config}")
JSON: ["#ff0000", "#00ff00", "#0000ff", "#ffff00"]

Config: {'theme': {'colors': ['#ff0000', '#00ff00', '#0000ff', '#ffff00']}}
CVD-Aware Palette Generation
You can generate palettes that are optimized for viewers with color vision
deficiencies (CVD). To do this, provide a cvd dictionary specifying the type
and severity of CVD to account for.
Here, we generate a palette that is safe for deuteranomaly (the most common form of CVD):
qp_cvd = Qualpal(
    cvd={'deutan': 0.7}  # 70% severity deuteranomaly
)

qp_cvd.generate(5)
Account for Background Color
When generating palettes, you can also specify a background color to ensure
good contrast. This is especially useful for generating palettes for dark
backgrounds. To do so, provide a background hex color string when creating
the Qualpal instance.
Here, we create a palette optimized for dark backgrounds:
qp_dark = Qualpal(background="#1a1a1a")
qp_dark.generate(4)
Compare this to a palette optimized for light backgrounds:
qp_light = Qualpal(background="#ffffff")
qp_light.generate(4)
Complete Example: Accessible Data Visualization Palette
Let’s create a complete palette suitable for accessible data visualization:
# Requirements:
# - 8 distinct colors
# - Work on white background
# - Safe for deuteranomaly (most common CVD)
# - Avoid very light or very dark colors

qp_accessible = Qualpal(
    colorspace={
        'h': (0, 360),
        's': (0.4, 0.9),
        'l': (0.3, 0.7)
    },
    background="#ffffff",
    cvd={'deutan': 0.5}
)

accessible_palette = qp_accessible.generate(8)

print("Accessible visualization palette:")
for i, color in enumerate(accessible_palette, 1):
    rgb = color.rgb255()
    print(f"  {i}. {color.hex()}  RGB{rgb}")

print(f"\nMinimum distance: {accessible_palette.min_distance():.2f}")
print("(Higher is better - minimum recommended: 30)")

accessible_palette
Accessible visualization palette:
  1. #4a732c  RGB(74, 115, 44)
  2. #f69263  RGB(246, 146, 99)
  3. #93190a  RGB(147, 25, 10)
  4. #318af2  RGB(49, 138, 242)
  5. #32f2ea  RGB(50, 242, 234)
  6. #e9ea16  RGB(233, 234, 22)
  7. #0e0c93  RGB(14, 12, 147)
  8. #f319b6  RGB(243, 25, 182)

Minimum distance: 38.51
(Higher is better - minimum recommended: 30)
Visualization
If you have matplotlib installed, you can visualize palettes using the show method,
which returns a figure with color swatches.
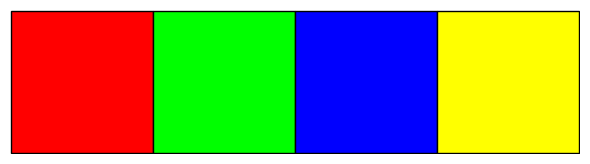
# Display color swatches
fig = pal.show()
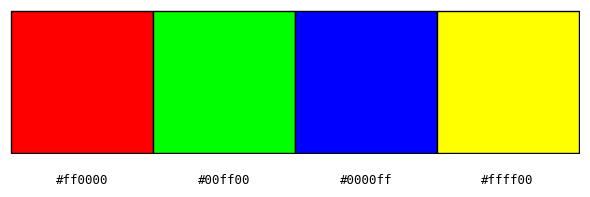
If you like, you can add labels of the hex codes to the swatches:
fig = pal.show(labels=True)
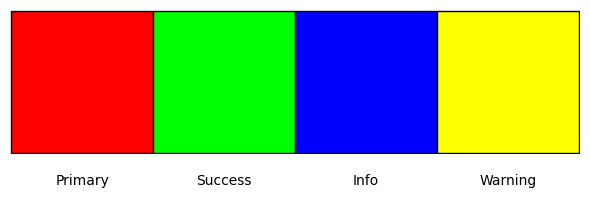
You can also provide custom labels:
# With custom labels
fig = pal.show(labels=["Primary", "Success", "Info", "Warning"])
The figures that are returned are matplotlib Figure objects and can be further customized or saved:
fig.savefig("palette.png", bbox_inches="tight")
For more details, see the API documentation.