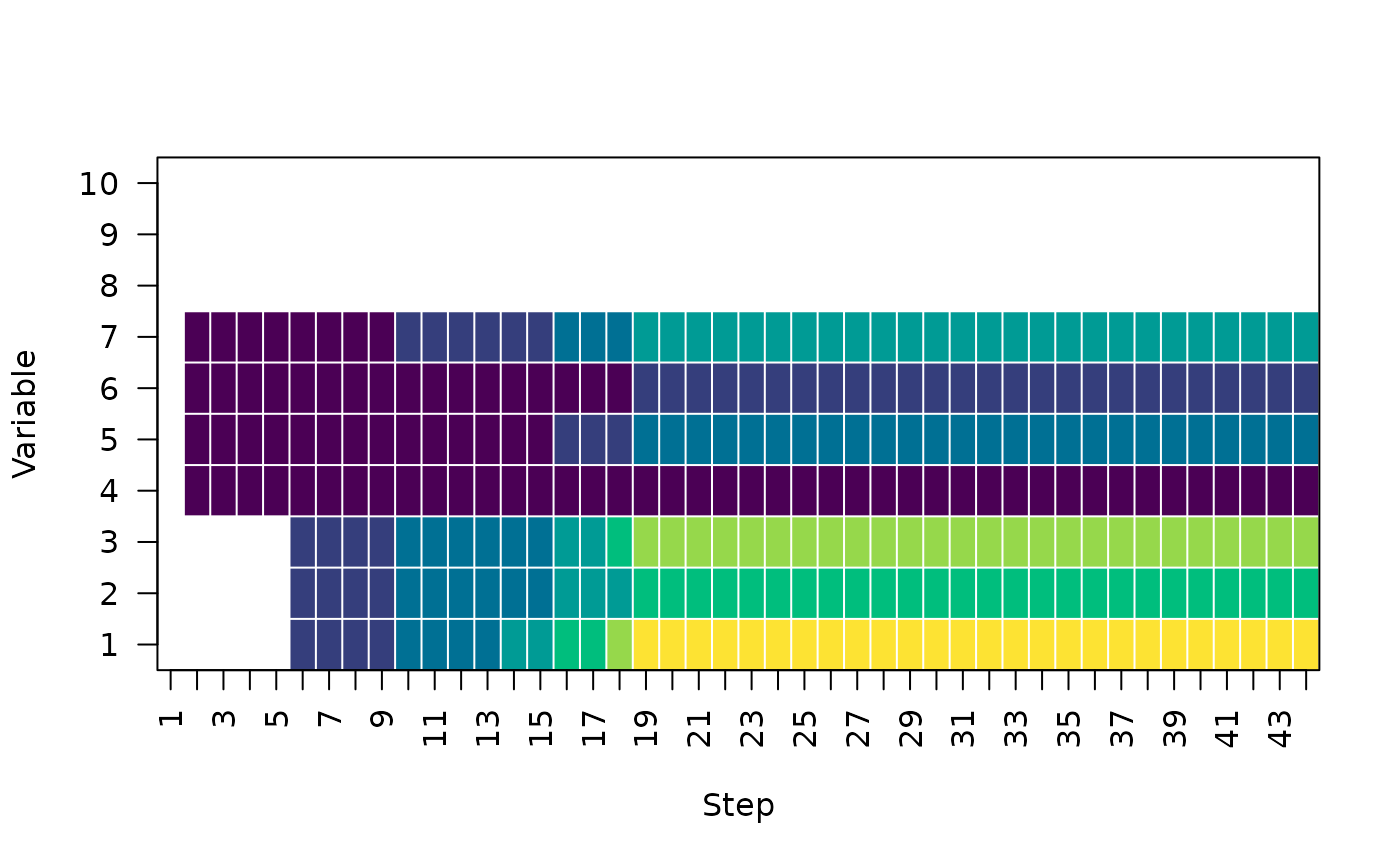
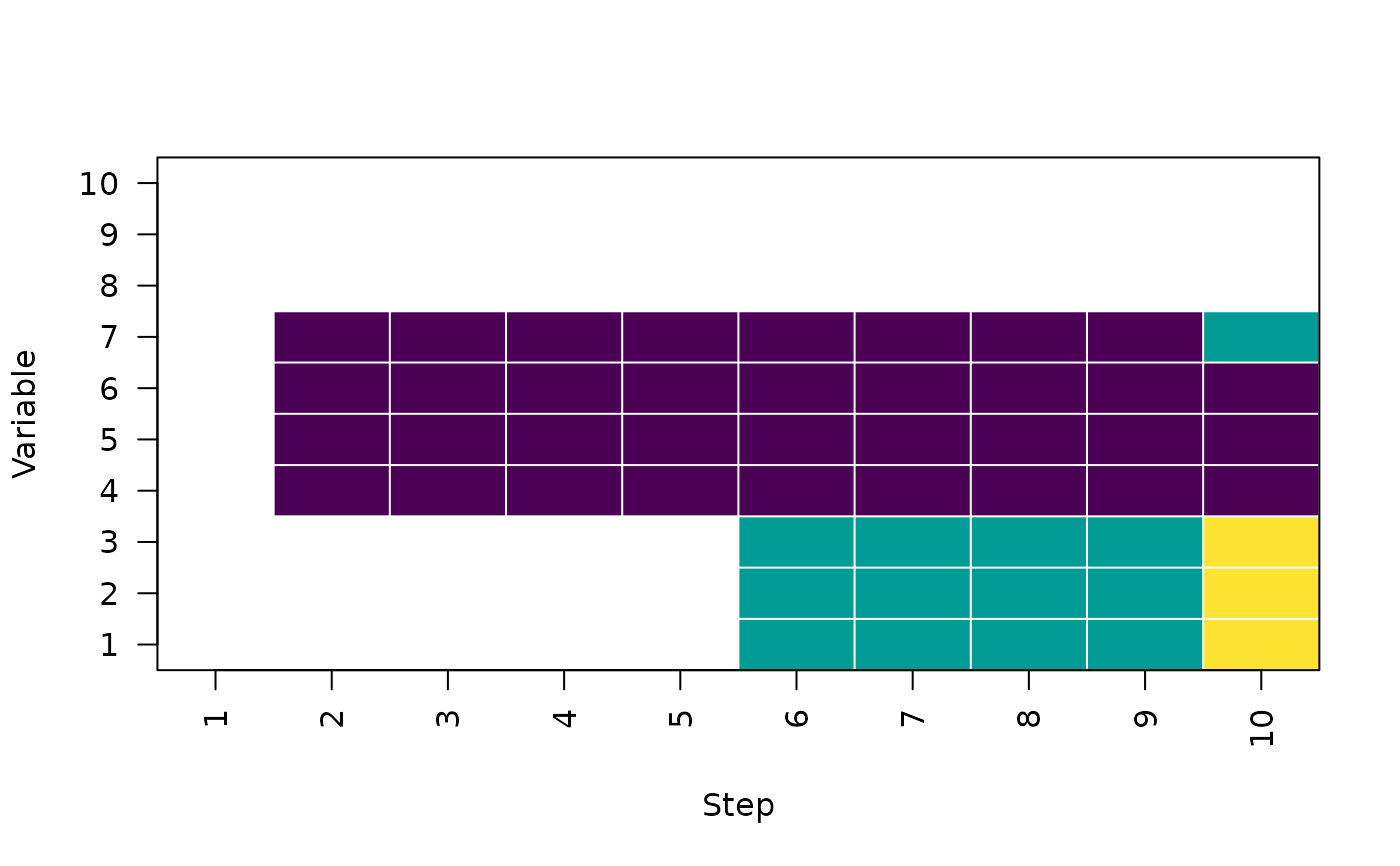
Note that this function requires the patterns argument to be set to
TRUE in the call to SLOPE(). Calling this function on a
SLOPE object without patterns will result in an error.
Usage
plotClusters(
  x,
  plot_signs = FALSE,
  color_clusters = TRUE,
  include_zeroes = TRUE,
  show_alpha = FALSE,
  alpha_steps = NULL,
  palette = "viridis",
  ...
)
Arguments
- x
an object of class
'SLOPE'- plot_signs
logical, indicating whether to plot signs of estimated coefficients on the plot
- color_clusters
logical, indicating whether the clusters should have different colors
- include_zeroes
logical, indicating whether zero variables should be plotted. Default to TRUE
- show_alpha
logical, indicating whether labels with alpha values or steps in the path should be plotted.
- alpha_steps
a vector of integer alpha steps to plot. If
NULL, all the steps are plotted.- palette
a character string specifying the color palette to use for the clusters. This is passed to
grDevices::hcl.colors().- ...
additional arguments passed to
graphics::image().