Plot Results from Diagnostics Collected During Model Fitting
Source:R/plot_diagnostics.R
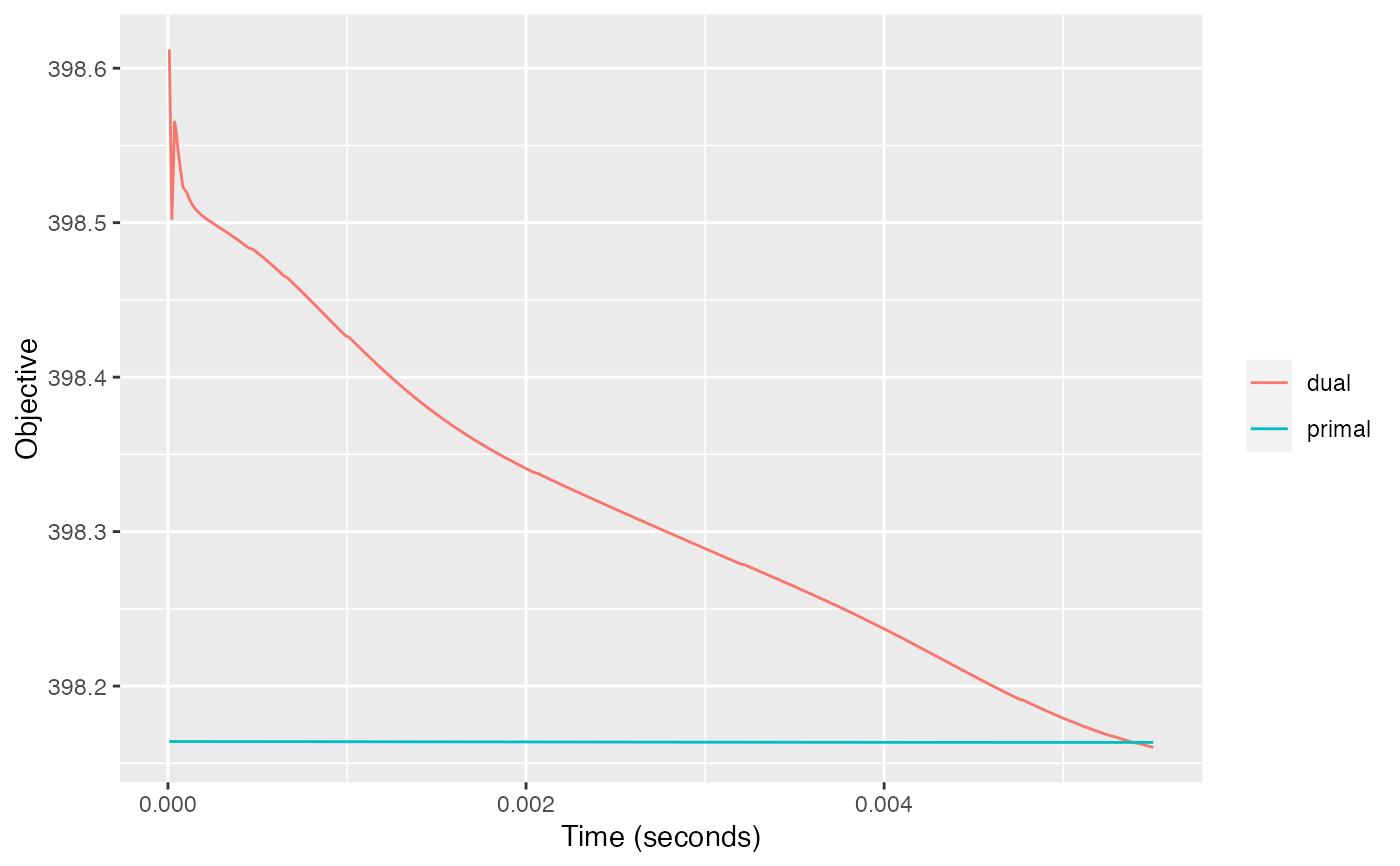
plotDiagnostics.RdThis function plots various diagnostics collected during
the model fitting resulting from a call to SLOPE() provided that
diagnostics = TRUE.
Examples
x <- SLOPE(abalone$x, abalone$y, diagnostics = TRUE)
plotDiagnostics(x)