Plot results from cross-validation
# S3 method for TrainedOwl
plot(
  x,
  measure = c("auto", "mse", "mae", "deviance", "auc", "misclass"),
  plot_min = TRUE,
  ci_alpha = 0.2,
  ci_border = FALSE,
  ci_col = lattice::trellis.par.get("superpose.line")$col,
  ...
)
Arguments
| x | an object of class |
|---|---|
| measure | any of the measures used in the call to |
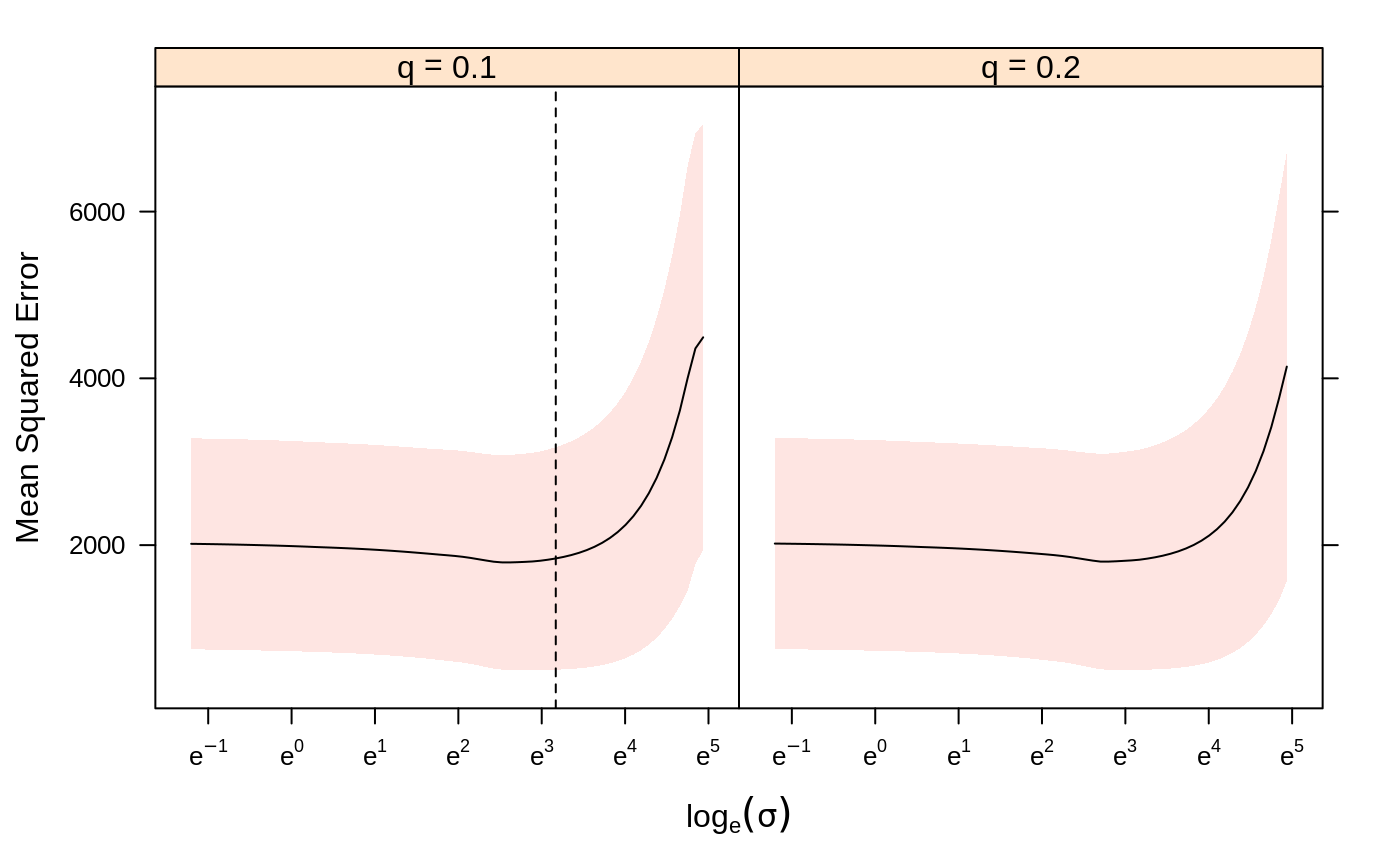
| plot_min | whether to mark the location of the penalty corresponding to the best prediction score |
| ci_alpha | alpha (opacity) for fill in confidence limits |
| ci_border | color (or flag to turn off and on) the border of the confidence limits |
| ci_col | color for border of confidence limits |
| ... | other arguments that are passed on to |
Value
An object of class 'trellis' is returned and, if used
interactively, will most likely have its print function
lattice::print.trellis()) invoked, which draws the plot on the
current display device.
See also
Examples
# Cross-validation for a SLOPE binomial model
set.seed(123)
tune <- trainOwl(subset(mtcars, select = c("mpg", "drat", "wt")),
                 mtcars$hp,
                 q = c(0.1, 0.2),
                 number = 10)
plot(tune, ci_col = "salmon", col = "black")