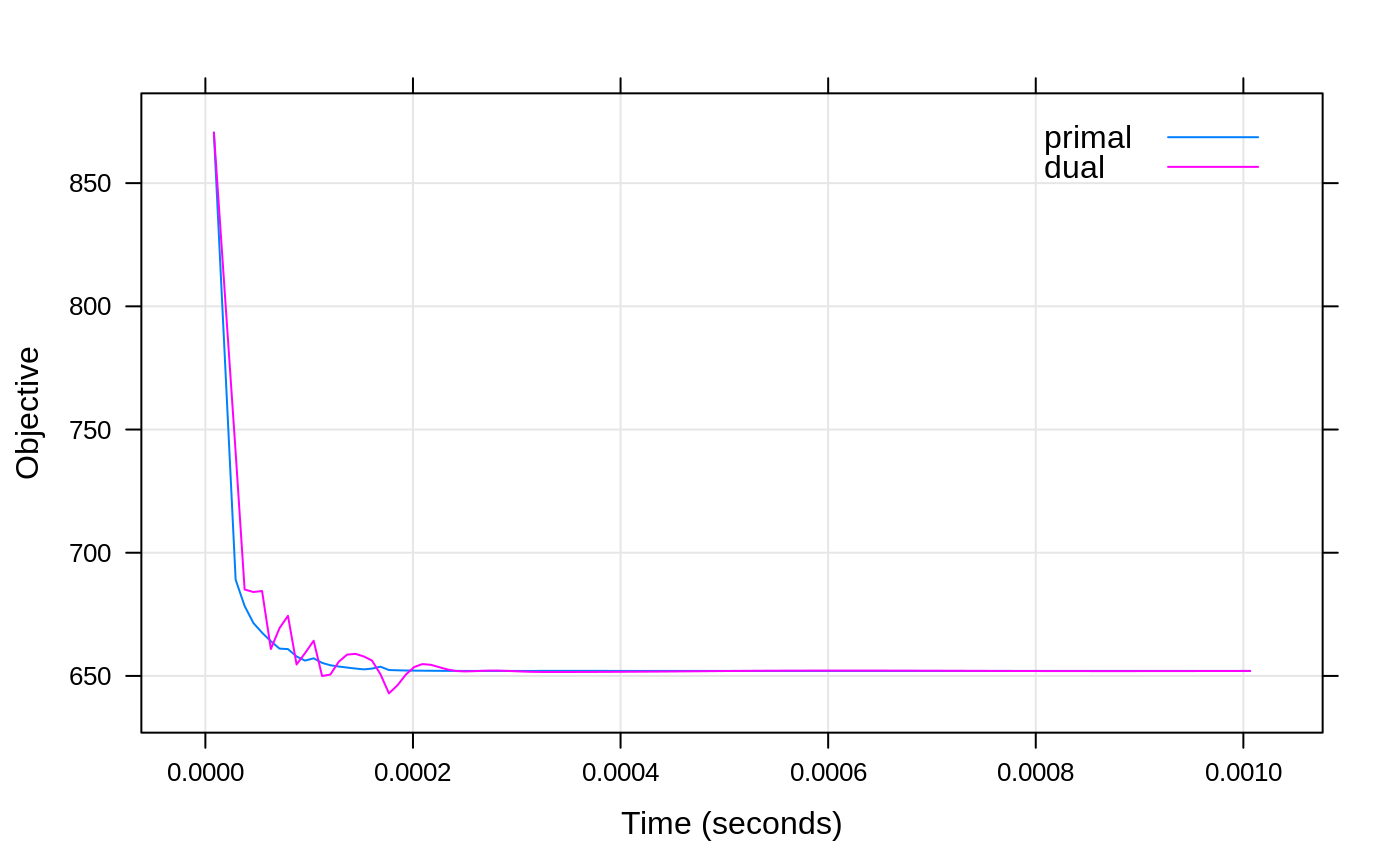
Plot results from diagnostics collected during model fitting
Source:R/plotDiagnostics.R
plotDiagnostics.RdThis function plots various diagnostics collected during
the model fitting resulting from a call to owl() provided that
diagnostics = TRUE.
plotDiagnostics(
  object,
  ind = max(object$diagnostics$penalty),
  xvar = c("time", "iteration"),
  yvar = c("objectives", "infeasibility"),
  ...
)
Arguments
| object | an object of class |
|---|---|
| ind | either "last" |
| xvar | what to place on the x axis. |
| yvar | what to place on the y axis. |
| ... | other arguments that will be used to modify the call to
|
Value
An object of class "trellis", which, unless stored in a variable,
will be plotted when its default print() method is called.