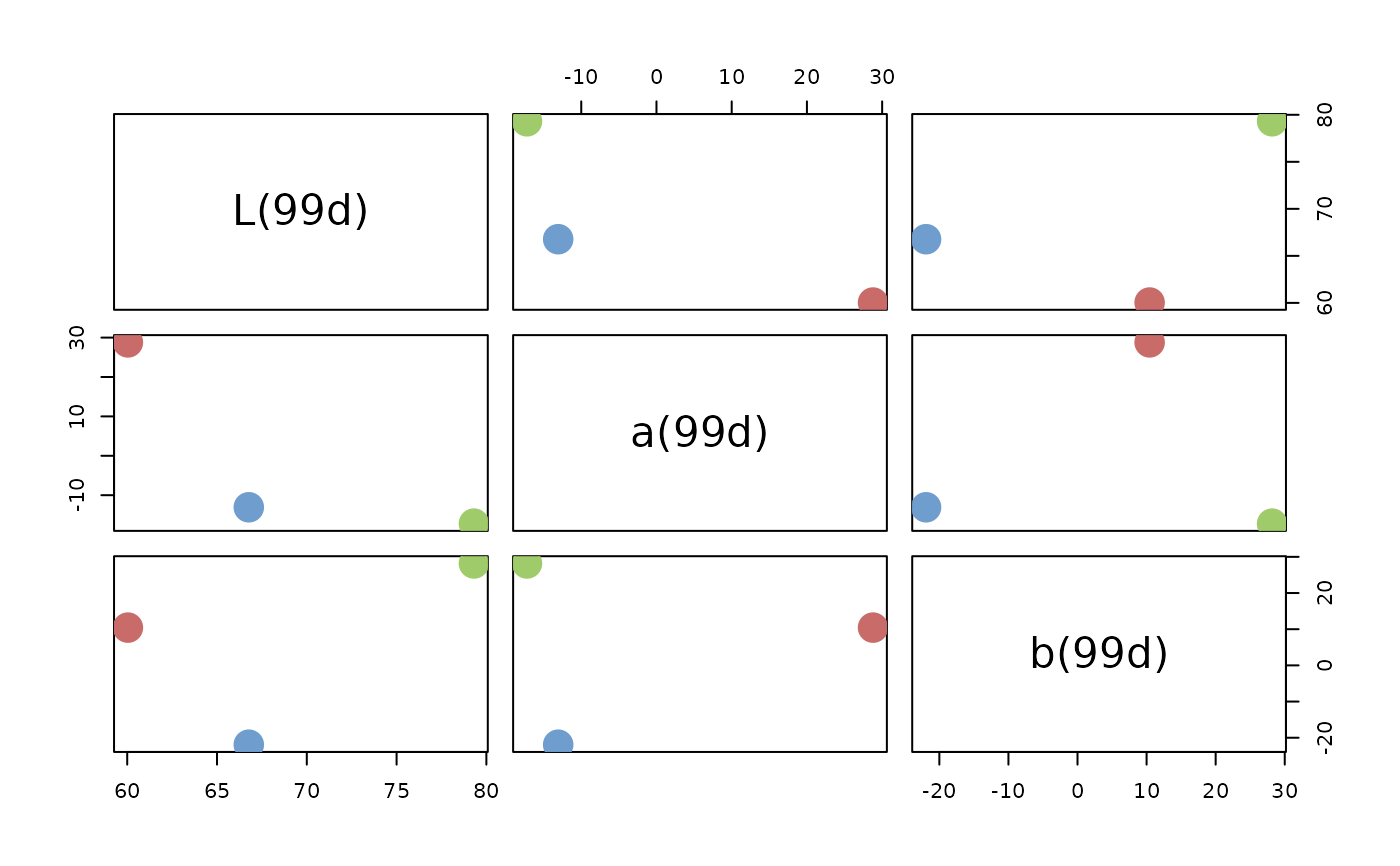
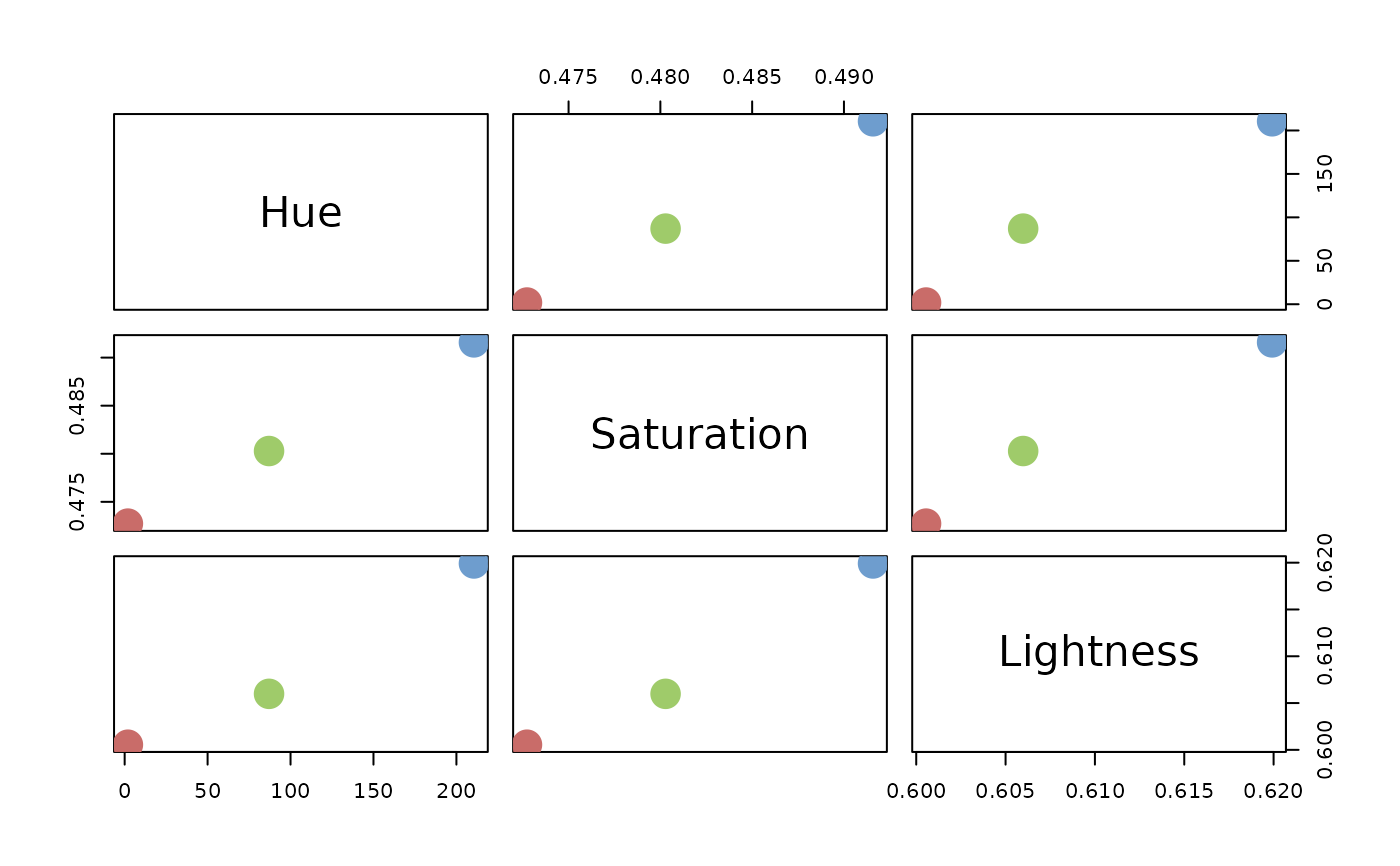
Plots the colors in an object of class "qualpal" as a scatterplot
matrix on either the DIN99d (the default) or HSL color space.
Usage
# S3 method for class 'qualpal'
pairs(x, colorspace = c("DIN99d", "HSL", "RGB"), ...)
Arguments
- x
A list object of class "qualpal" generated from
qualpal.
- colorspace
The color space in which to plot the colors ("DIN99d",
"HSL", or "RGB").
- ...
Arguments to pass on to pairs.