A gallery of Euler and Venn diagrams
This page is a gallery of Euler and Venn diagrams and a showcase of the
customization options available through plot(). It is the
Python counterpart to the eulerr
gallery.
import matplotlib.pyplot as plt

import eunoia as eu
Euler diagrams
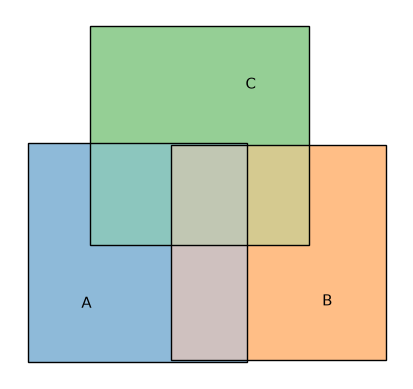
Uniform intersections
Here we use squares instead of the default circles.
fit = eu.euler(
    {
        "A": 10,
        "B": 10,
        "C": 10,
        "A&B": 4,
        "A&C": 4,
        "B&C": 4,
        "A&B&C": 2,
    },
    shape="square",
)
fit.plot();
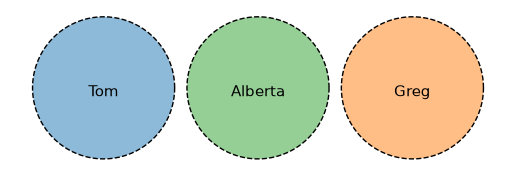
Disjoint sets
Rename the sets simply by choosing the dictionary keys. A flat edges dict is
applied to every outline.
fit = eu.euler({"Tom": 1, "Greg": 1, "Alberta": 1})
fit.plot(edges={"linestyle": "--"});
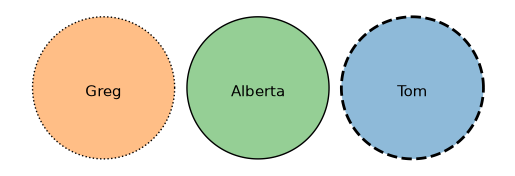
To style each outline independently, pass edges as a dict keyed by set name
(each value a dict of PathPatch kwargs) or as a sequence of such dicts, one
per set in shape order, mirroring how colors accepts a per-set dict.
fit = eu.euler({"Tom": 1, "Greg": 1, "Alberta": 1})
fit.plot(
    edges={
        "Tom": {"linestyle": "--", "linewidth": 2},
        "Greg": {"linestyle": ":"},
    },
);
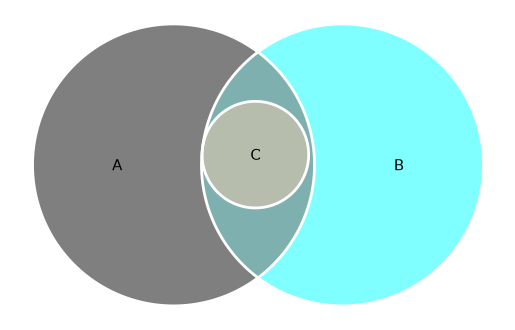
A set contained in the intersection of two sets
fit = eu.euler(
    {
        "A": 15,
        "B": 15,
        "C": 0,
        "A&B": 3,
        "A&C": 0,
        "B&C": 0,
        "A&B&C": 3,
    }
)
fit.plot(
    colors=["black", "cyan", "orange"],
    edges={"edgecolor": "white", "linewidth": 2},
);
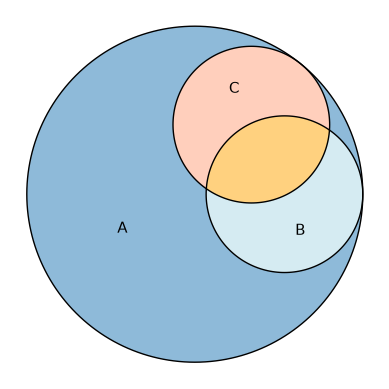
Two sets intersecting inside a third
Here we override individual region fills with per-region fills styles.
fit = eu.euler(
    {
        "A": 15,
        "B": 0,
        "C": 0,
        "A&B": 3,
        "A&C": 3,
        "B&C": 0,
        "A&B&C": 2,
    }
)
fit.plot(
    fills={
        "A&B&C": {"facecolor": "orange"},
        "A&B": {"facecolor": "lightblue"},
        "A&C": {"facecolor": "lightsalmon"},
    },
);
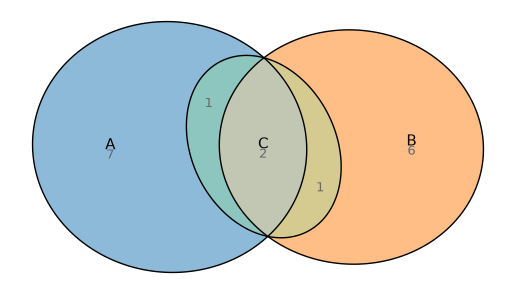
Difficult set (for circles!)
This relationship cannot be drawn exactly with circles but works well with ellipses.
fit = eu.euler(
    {"A": 7, "B": 6, "C": 0, "A&B": 0, "A&C": 1, "B&C": 1, "A&B&C": 2},
    shape="ellipse",
)
fit.plot(quantities=True);
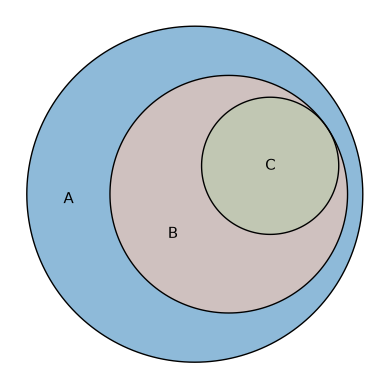
Russian doll
Sets intersecting inside other sets.
fit = eu.euler(
    {
        "A": 15,
        "B": 0,
        "C": 0,
        "A&B": 10,
        "A&C": 0,
        "B&C": 0,
        "A&B&C": 5,
    }
)
fit.plot();
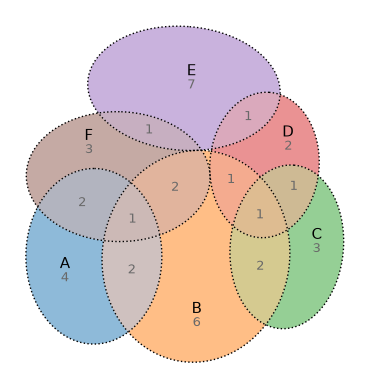
Wilkinson set relationship
This set relationship is taken from Wilkinson et al. It works best with ellipses. We show the fitted values rather than the requested ones.
fit = eu.euler(
    {
        "A": 4,
        "B": 6,
        "C": 3,
        "D": 2,
        "E": 7,
        "F": 3,
        "A&B": 2,
        "A&F": 2,
        "B&C": 2,
        "B&D": 1,
        "B&F": 2,
        "C&D": 1,
        "D&E": 1,
        "E&F": 1,
        "A&B&F": 1,
        "B&C&D": 1,
    },
    shape="ellipse",
)
fit.plot(quantities="fitted", edges={"linestyle": ":"});
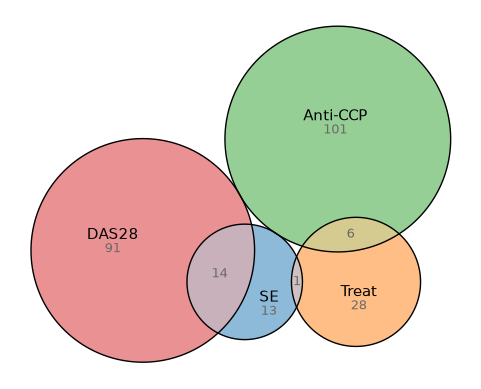
Gene set
fit = eu.euler(
    {
        "SE": 13,
        "Treat": 28,
        "Anti-CCP": 101,
        "DAS28": 91,
        "SE&Treat": 1,
        "SE&DAS28": 14,
        "Treat&Anti-CCP": 6,
        "SE&Anti-CCP&DAS28": 1,
    }
)
fit.plot(quantities=True);
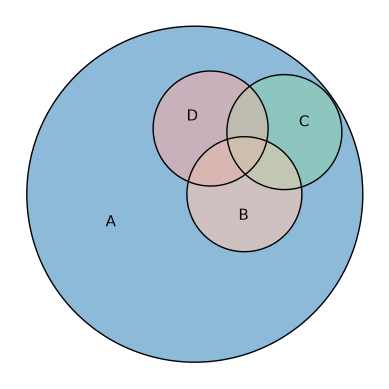
Three sets intersecting inside a fourth
fit = eu.euler(
    {
        "A": 30,
        "A&B": 3,
        "A&C": 3,
        "A&D": 3,
        "A&B&C": 0.4,
        "A&B&D": 0.4,
        "A&C&D": 0.4,
        "A&B&C&D": 1,
    }
)
fit.plot();
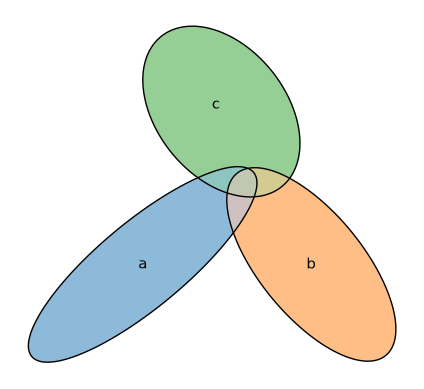
eulerAPE combination
A combination taken from the eulerAPE article, fit with ellipses.
fit = eu.euler(
    {
        "a": 3491,
        "b": 3409,
        "c": 3503,
        "a&b": 120,
        "a&c": 114,
        "b&c": 132,
        "a&b&c": 126,
    },
    shape="ellipse",
)
fit.plot();
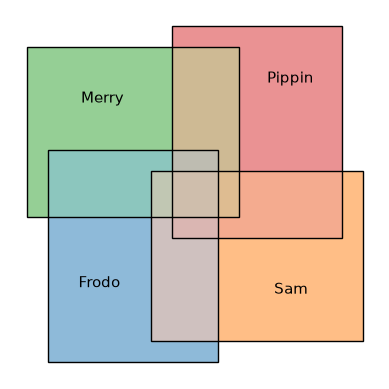
Four uniform interactions
This time we fit the diagram using rectangles.
fit = eu.euler(
    {
        "Frodo": 10,
        "Sam": 10,
        "Merry": 10,
        "Pippin": 10,
        "Frodo&Sam": 3,
        "Frodo&Merry": 3,
        "Frodo&Pippin": 0,
        "Sam&Merry": 0,
        "Sam&Pippin": 3,
        "Merry&Pippin": 3,
        "Frodo&Sam&Merry": 1,
        "Frodo&Sam&Pippin": 1,
        "Frodo&Merry&Pippin": 1,
        "Sam&Merry&Pippin": 1,
        "Frodo&Sam&Merry&Pippin": 1,
    },
    shape="rectangle",
)
fit.plot();
Two circles intersecting completely
fit = eu.euler({"A": 0, "B": 0, "A&B": 10})
fit.plot();
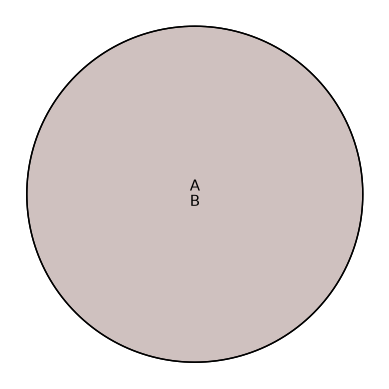
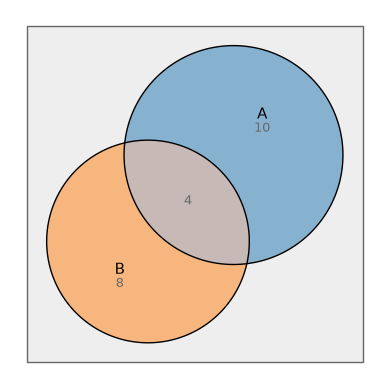
Styling and the complement
A universe (complement) box
Pass complement= to euler() to reserve area outside every set;
it comes back as a container that plot() draws behind
everything. The complement= plot keyword styles that box.
fit = eu.euler({"A": 10, "B": 8, "A&B": 4}, complement=20)
fit.plot(complement={"facecolor": "#eeeeee"}, quantities=True);
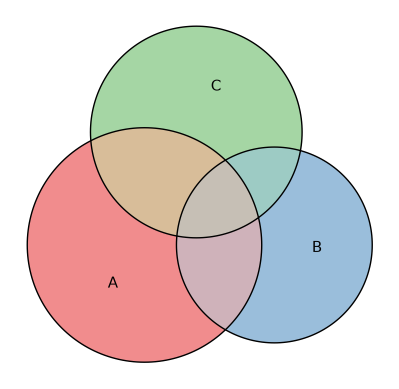
Colors as a sequence or a mapping
colors accepts either a sequence (one per set, in fit order) or a mapping from
set name to color.
fit = eu.euler(
    {"A": 10, "B": 7, "C": 8, "A&B": 3, "A&C": 4, "B&C": 2, "A&B&C": 1}
)
fit.plot(colors={"A": "#e41a1c", "B": "#377eb8", "C": "#4daf4a"});
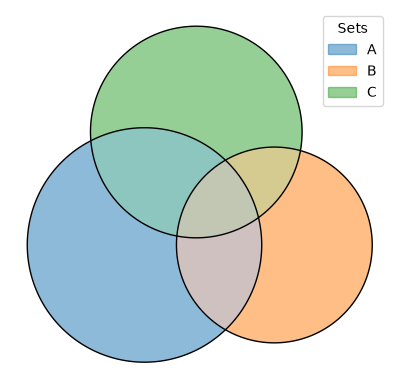
A legend instead of inline labels
Inline labels that don’t fit their region are placed outside the diagram with a
leader line, but for very dense diagrams a legend can still be cleaner. Passing
legend=True moves the set names into a color-keyed legend and turns the inline
labels off by default (pass labels=True to keep both). A dict is forwarded to
matplotlib’s Axes.legend, so you can control placement and title.
fit = eu.euler(
    {"A": 10, "B": 7, "C": 8, "A&B": 3, "A&C": 4, "B&C": 2, "A&B&C": 1}
)
fit.plot(legend={"loc": "upper right", "title": "Sets"});
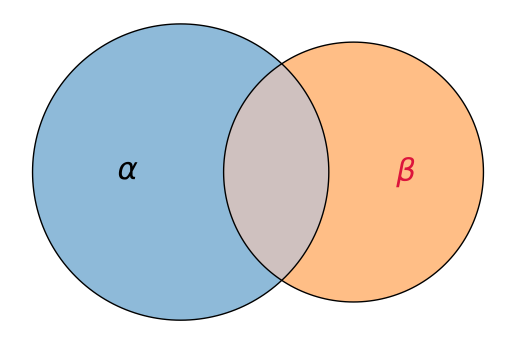
Custom label text and style
labels can be a dict for per-set control. Map a set name to a replacement
string (matplotlib mathtext
works, which is part of why we picked matplotlib), to an Axes.text kwargs dict
(with an optional "text" key for custom text), or to None/False to hide
that set’s label. A dict whose keys are not set names (e.g.
{"fontsize": 14}) is a uniform style applied to every label instead.
fit = eu.euler({"alpha": 10, "beta": 7, "alpha&beta": 3})
fit.plot(
    labels={
        "alpha": {"text": r"$\alpha$", "fontsize": 22},
        "beta": {"text": r"$\beta$", "fontsize": 22, "color": "crimson"},
    },
);
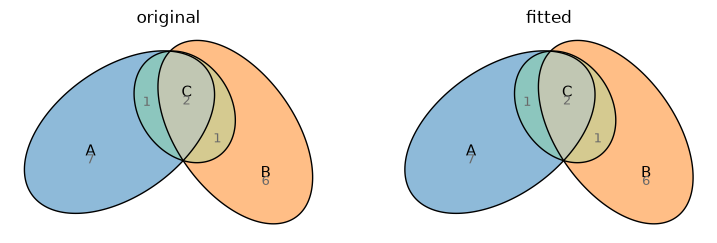
Original versus fitted quantities
Drawing into axes we create ourselves lets us place two diagrams side by side to compare the requested values against what the layout achieved.
fit = eu.euler(
    {"A": 7, "B": 6, "A&C": 1, "B&C": 1, "A&B&C": 2, "C": 0},
    shape="ellipse",
)

fig, (left, right) = plt.subplots(1, 2, figsize=(9, 4))
fit.plot(ax=left, quantities="original")
left.set_title("original")
fit.plot(ax=right, quantities="fitted")
right.set_title("fitted")
fig;
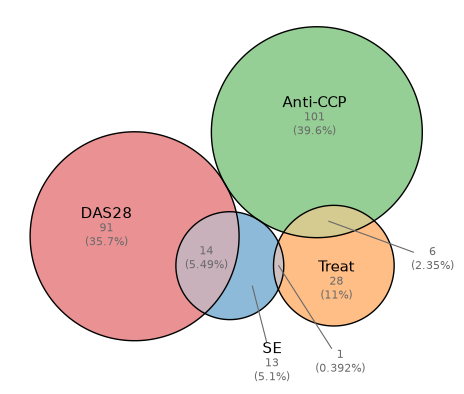
Counts and percentages
quantities also chooses how to display each region. A string picks the
display type—"counts" (the raw value, the default) or "percent" (the
region’s share of the total)—while a dict combines a type, a value source, and
text styling. Passing both types stacks the count above its percentage.
fit = eu.euler(
    {
        "SE": 13,
        "Treat": 28,
        "Anti-CCP": 101,
        "DAS28": 91,
        "SE&Treat": 1,
        "SE&DAS28": 14,
        "Treat&Anti-CCP": 6,
        "SE&Anti-CCP&DAS28": 1,
    }
)
fit.plot(quantities={"type": ["counts", "percent"], "fontsize": 8});
Venn diagrams
venn() draws topological (non-proportional) Venn diagrams. It
accepts an integer count, a list of names, or a mapping. The default shape is
the ellipse, which supports one through five sets.
{note} Circle Venn diagrams are unsupported in the pinned Eunoia core and raise an {class}`~eunoia.EunoiaError`. Use ellipses (1–5 sets) or squares/rectangles (1–3 sets).
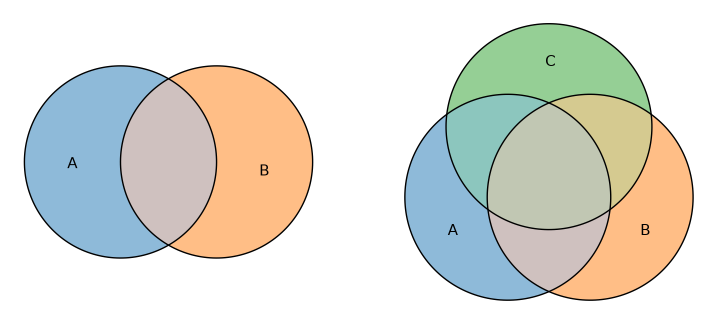
Two and three sets
fig, (left, right) = plt.subplots(1, 2, figsize=(9, 4))
eu.venn(2).plot(ax=left)
eu.venn(["A", "B", "C"]).plot(ax=right)
fig;
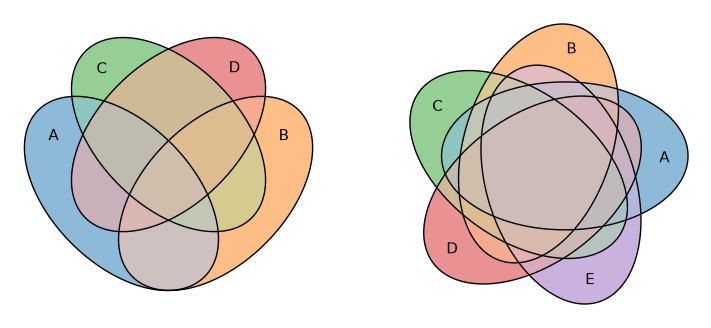
Four and five sets
fig, (left, right) = plt.subplots(1, 2, figsize=(9, 4))
eu.venn(4).plot(ax=left)
eu.venn(5).plot(ax=right)
fig;
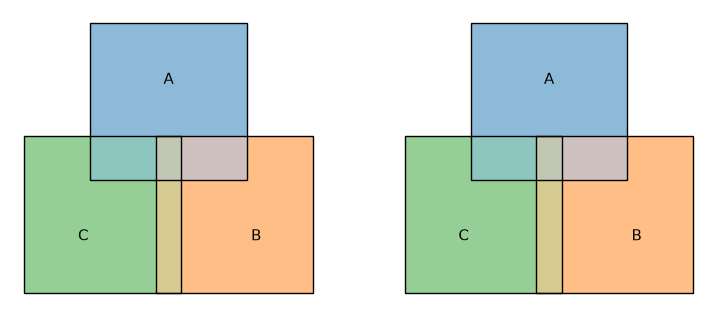
Squares and rectangles
Square and rectangle Venn diagrams support up to three sets.
fig, (left, right) = plt.subplots(1, 2, figsize=(9, 4))
eu.venn(3, shape="square").plot(ax=left)
eu.venn(3, shape="rectangle").plot(ax=right)
fig;
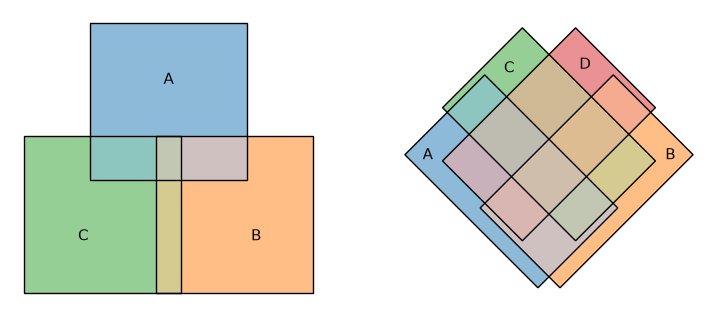
Rotated rectangles
Rotated rectangles support up to four sets. The four-set layout tilts the rectangles so that all 15 regions open up, the rectangular analogue of the classic four-ellipse Venn diagram.
fig, (left, right) = plt.subplots(1, 2, figsize=(9, 4))
eu.venn(3, shape="rotated_rectangle").plot(ax=left)
eu.venn(4, shape="rotated_rectangle").plot(ax=right)
fig;
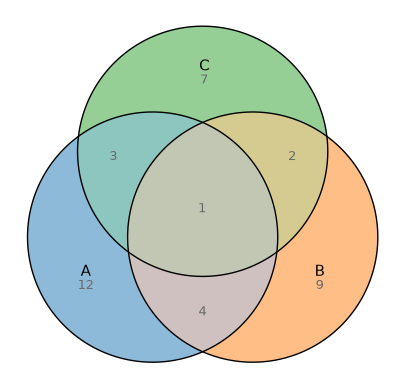
With region quantities
venn accepts the same value mapping as euler. The layout stays topological,
but the values are kept as original_values and plot() labels each region
automatically (pass quantities=False to suppress them). This is the usual
“Venn diagram with subset sizes” plot.
eu.venn(
    {
        "A": 12, "B": 9, "C": 7,
        "A&B": 4, "A&C": 3, "B&C": 2, "A&B&C": 1,
    }
).plot();
Use input="inclusive" when the values are total set sizes (overlaps included)
rather than per-region counts.
From membership lists
venn accepts the same membership-list input as euler; it counts each element
into its region, so the quantities are shown just as above.
eu.venn({"A": ["x", "y", "z"], "B": ["y", "z", "w"], "C": ["z", "w", "q"]}).plot();
