Quickstart
A two-set fit
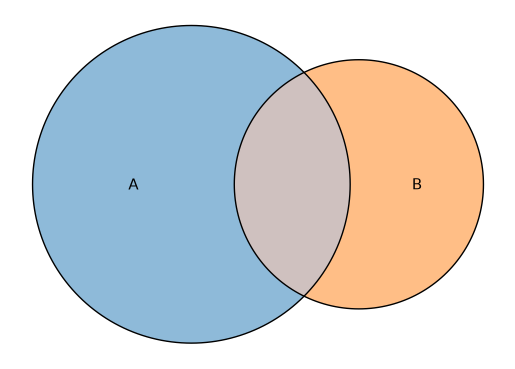
The simplest case: two sets with one overlap.
import eunoia as eu

fit = eu.euler({"A": 10, "B": 5, "A&B": 3})
print(fit)
EulerFit (2 circles, diag_error=3.777e-13, stress=4.838e-25, loss=1.124e-24)
         original      fitted    residual regionError
  A            10          10  -4.597e-12   3.777e-13
  B             5           5  -6.758e-12    5.89e-14
  A&B           3           3  -9.156e-12   3.187e-13
fit.plot();
Inclusive input
By default, values are interpreted as exclusive per-region areas. If your
numbers are total set sizes that include overlaps, pass input="inclusive" and
the Eunoia core converts internally:
fit = eu.euler({"A": 13, "B": 8, "A&B": 3}, input="inclusive")
fit.original_values, fit.fitted_values
({'A': 13.0, 'B': 8.0, 'A&B': 3.0},
 {'A': 13.000000000013753, 'B': 8.000000000015914, 'A&B': 3.0000000000091562})
Membership lists
Instead of region areas, you can pass each set its members. Every element is counted into the region of the sets it belongs to, giving exclusive per-region counts:
fit = eu.euler(
    {
        "A": ["x", "y", "z"],
        "B": ["y", "z", "w"],
        "C": ["z", "w", "q"],
    }
)
fit.original_values
{'A&B&C': 1.0, 'A&B': 1.0, 'A': 1.0, 'B&C': 1.0, 'C': 1.0}
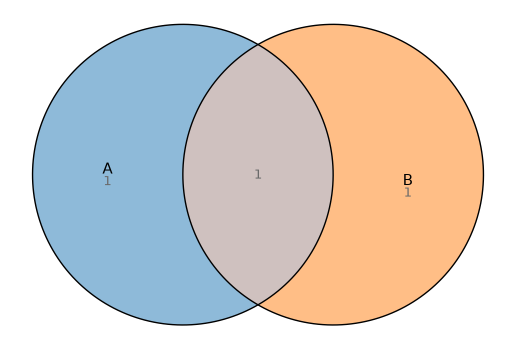
Elements are deduplicated within a set and stringified, so sets, tuples, and
non-string labels all work. venn() accepts the same shape (it only needs the
set names):
eu.venn({"A": ["x", "y"], "B": ["y", "z"]}).plot();
DataFrames
A pandas or polars DataFrame (anything narwhals
supports) is read as a membership matrix: each column is a set, each row an
observation, and a truthy cell means that observation belongs to the set.
Columns must be boolean or 0/1 numeric:
import pandas as pd

df = pd.DataFrame(
    {
        "A": [1, 1, 0, 1, 0],
        "B": [0, 1, 1, 1, 0],
        "C": [0, 0, 1, 1, 1],
    }
)
eu.euler(df).original_values
{'C': 1.0, 'B&C': 1.0, 'A': 1.0, 'A&B': 1.0, 'A&B&C': 1.0}
Rows that belong to no set are dropped, and venn(df) takes the column names as
the set names. The same works for polars frames.
NumPy arrays
A plain numpy boolean array is read as a membership matrix too (the matrix idiom
from eulerr): a 2D (n_observations, n_sets) array, or a 1D array for a single
set. An array carries no column names, so pass them with names= (otherwise
sets are named A, B, …):
import numpy as np

rng = np.random.default_rng(0)
arr = rng.random((100, 3)) < 0.4  # 3 boolean columns
eu.euler(arr, names=["A", "B", "C"]).original_values
{'C': 17.0,
 'B': 13.0,
 'B&C': 12.0,
 'A': 14.0,
 'A&C': 10.0,
 'A&B': 4.0,
 'A&B&C': 2.0}
Values may also be 0/1 numeric, and NaN cells count as non-members. This
scales to many columns: a 13-column boolean matrix is too many sets for a true
Venn diagram, but eu.euler(arr, shape="circle") still fits an
area-proportional Euler diagram.
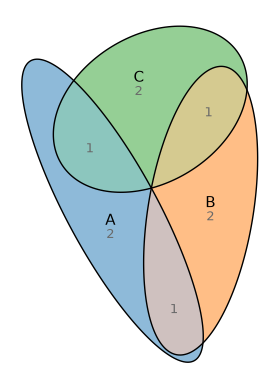
Three sets with ellipses
Ellipses are more flexible than circles and can fit many three-set arrangements exactly:
fit = eu.euler(
    {"A": 2, "B": 2, "C": 2, "A&B": 1, "A&C": 1, "B&C": 1},
    shape="ellipse",
)
print(f"diag_error = {fit.diag_error:.3g}")
fit.plot(quantities="fitted");
diag_error = 1.37e-12
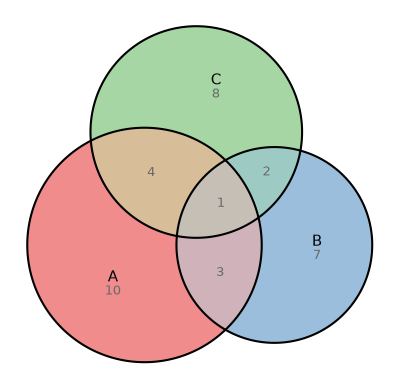
Custom styling
fit = eu.euler({"A": 10, "B": 7, "C": 8, "A&B": 3, "A&C": 4, "B&C": 2, "A&B&C": 1})
fit.plot(
    colors=["#e41a1c", "#377eb8", "#4daf4a"],
    quantities=True,
    edges={"linewidth": 1.5},
);
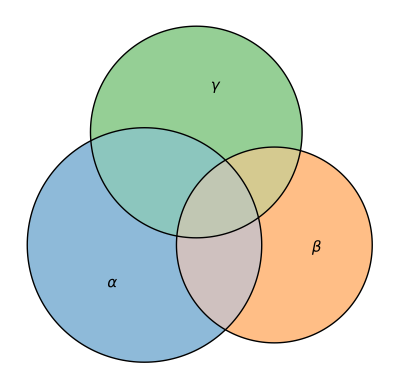
Math text in labels
Set names are drawn as matplotlib text, so anything between $…$ is rendered
with its mathtext
engine. Use Greek letters, subscripts, or full TeX as set names and they carry
through to the labels and legend:
fit = eu.euler(
    {
        r"$\alpha$": 10,
        r"$\beta$": 7,
        r"$\gamma$": 8,
        r"$\alpha$&$\beta$": 3,
        r"$\alpha$&$\gamma$": 4,
        r"$\beta$&$\gamma$": 2,
        r"$\alpha$&$\beta$&$\gamma$": 1,
    }
)
fit.plot();
Reproducibility
Pass a seed to fix the optimizer’s RNG:
fit_a = eu.euler({"A": 10, "B": 5, "A&B": 3}, seed=42)
fit_b = eu.euler({"A": 10, "B": 5, "A&B": 3}, seed=42)
fit_a.diag_error == fit_b.diag_error
True