Eunoia
Python bindings for the Eunoia Rust library for area-proportional Euler and Venn diagrams. Sister package to the R package eulerr.
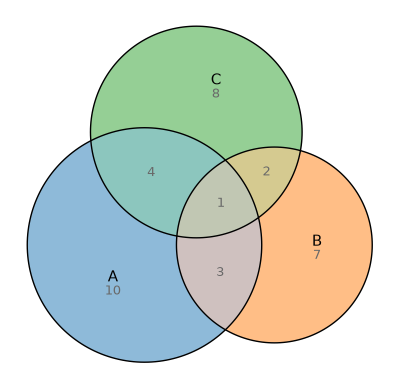
An Euler diagram lays out one shape per set and sizes and positions them so that every region’s area is proportional to the quantity it represents. Eunoia fits that layout with a fast Rust optimizer and draws it with matplotlib:
import eunoia as eu

fit = eu.euler(
    {"A": 10, "B": 7, "C": 8, "A&B": 3, "A&C": 4, "B&C": 2, "A&B&C": 1}
)
fit.plot(quantities=True);
Why Eunoia
Area-proportional. Region areas track your numbers, so the picture is quantitative, not just topological.
Several shapes. Fit with circles, ellipses, squares, or rectangles. Ellipses handle relationships that circles cannot draw exactly.
Flexible input. Pass per-region areas, inclusive set sizes, membership lists, a pandas/polars DataFrame, or a numpy boolean array read as a membership matrix.
Venn diagrams too.
venn()draws topological Venn diagrams for one to five sets.Matplotlib native. Plots are ordinary
Axes, so they slot into figures, subplots, and your usual styling.Fast and typed. The optimizer is Rust; the API is fully type-annotated and ships a
py.typedmarker.
Install
pip install eunoia
Wheels are published for Linux, macOS, and Windows; no Rust toolchain is needed to install.
At a glance
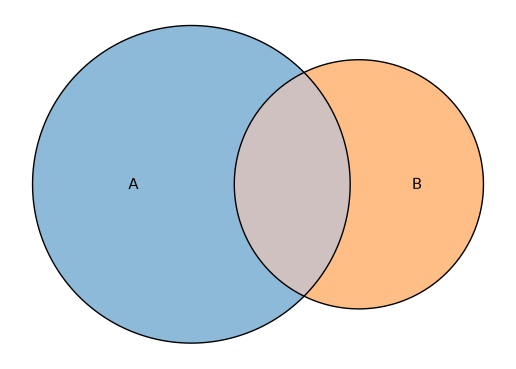
The fit object holds the requested and fitted values and can plot itself:
fit = eu.euler({"A": 10, "B": 5, "A&B": 3})
print(fit)
fit.plot();
EulerFit (2 circles, diag_error=3.777e-13, stress=4.838e-25, loss=1.124e-24)
         original      fitted    residual regionError
  A            10          10  -4.597e-12   3.777e-13
  B             5           5  -6.758e-12   5.895e-14
  A&B           3           3  -9.156e-12   3.188e-13
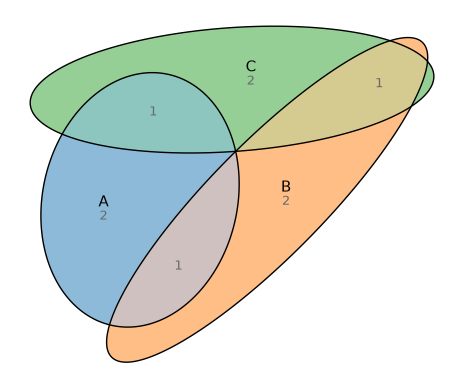
Swap in ellipses (or "square", "rectangle") for arrangements circles cannot
capture, and label regions with their fitted values:
fit = eu.euler(
    {"A": 2, "B": 2, "C": 2, "A&B": 1, "A&C": 1, "B&C": 1},
    shape="ellipse",
)
fit.plot(quantities="fitted");
Next steps
Quickstart walks through the input formats and common options.
A gallery of Euler and Venn diagrams showcases shapes, styling, and Venn diagrams.
Comparison with other Python packages benchmarks Eunoia against related tools.
API reference is the full reference.