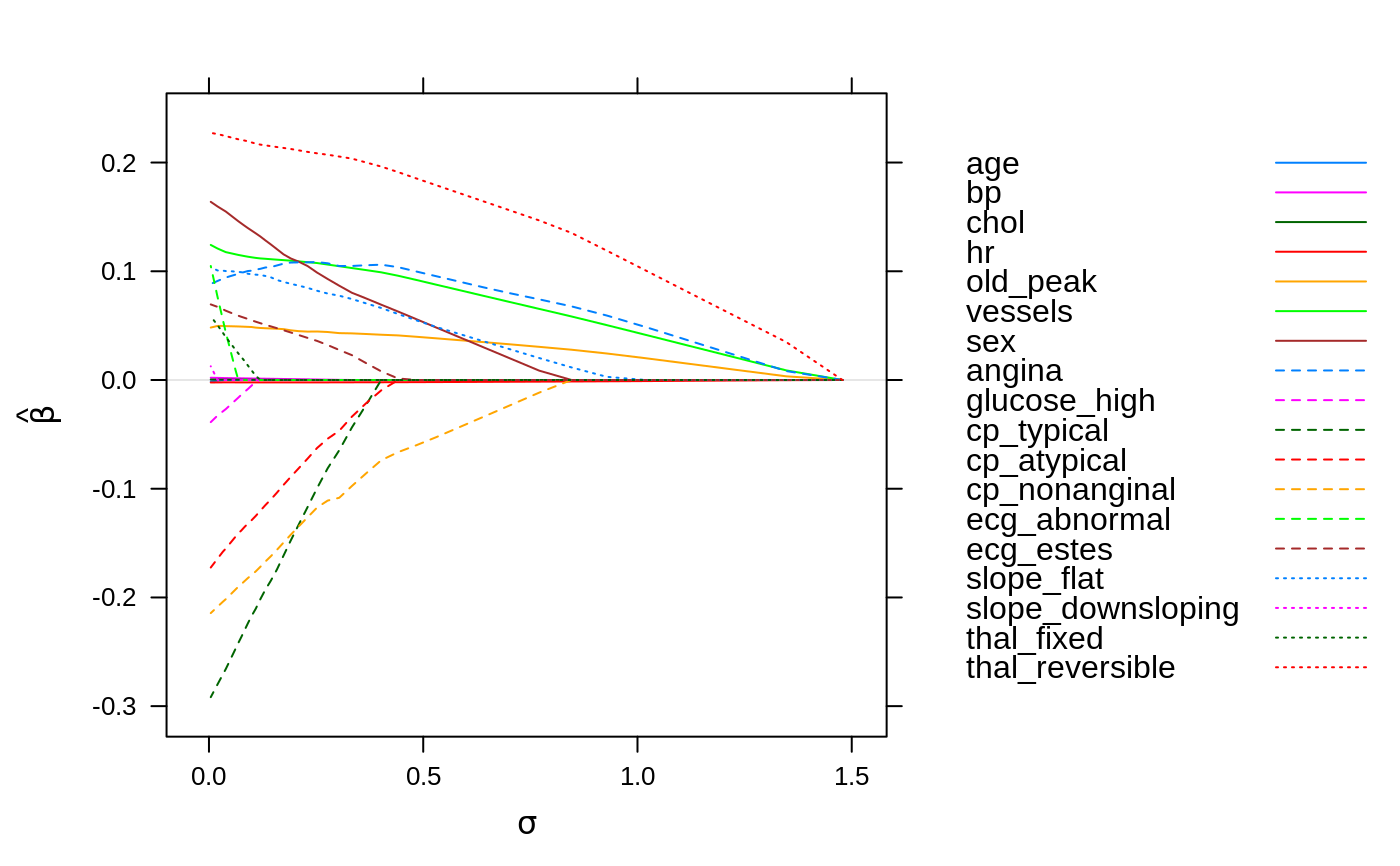
Plot the model's coefficient along the regularization path.
# S3 method for Owl
plot(x, intercept = FALSE, ...)
Arguments
| x | an object of class |
|---|---|
| intercept | whether to plot the intercept |
| ... | parameters that will be used to modify the call to
|
Value
An object of class "trellis", which will be plotted on the
current device unless stored in a variable.