The tactile theme
tactile
Johan Larsson
2025-12-15
Source:vignettes/tactile-theme.Rmd
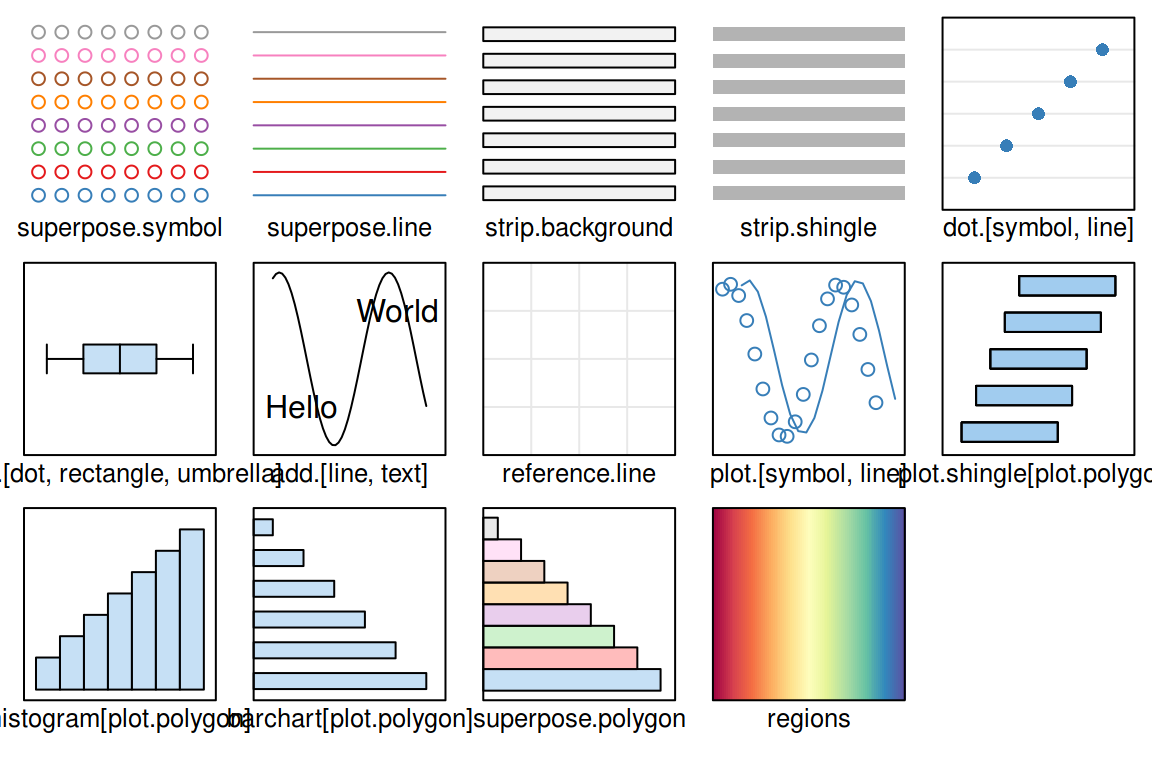
tactile-theme.Rmdtactile introduces a new theme for latice that does a few things, namely
- minimizes paddings around the plot,
- halves axis tick lengths,
- uses a color theme based on RColorBrewer,
- decreases title size slightly,
- Sets strip backgrounds to grey.
We now turn to illustrating the differences. First, we use
lattice::show.settings() for an overview over the default
settings.
library(tactile)
#> Loading required package: lattice
show.settings()
show.settings(tactile.theme())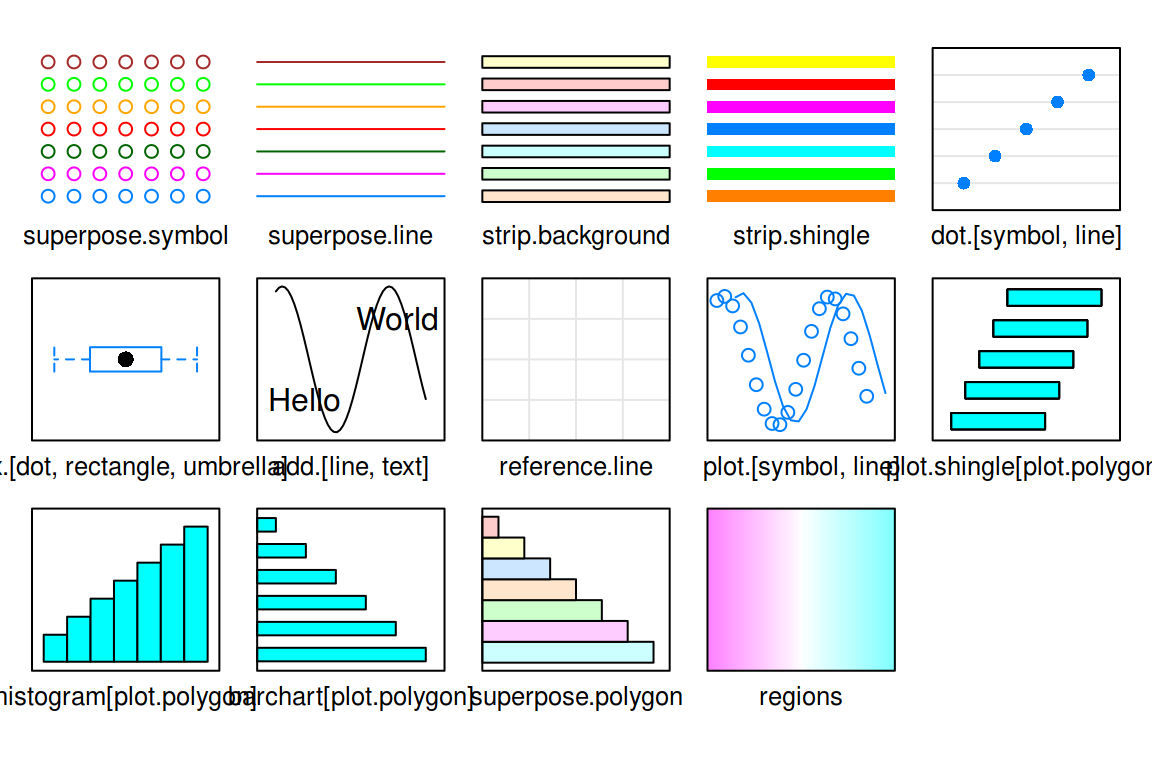
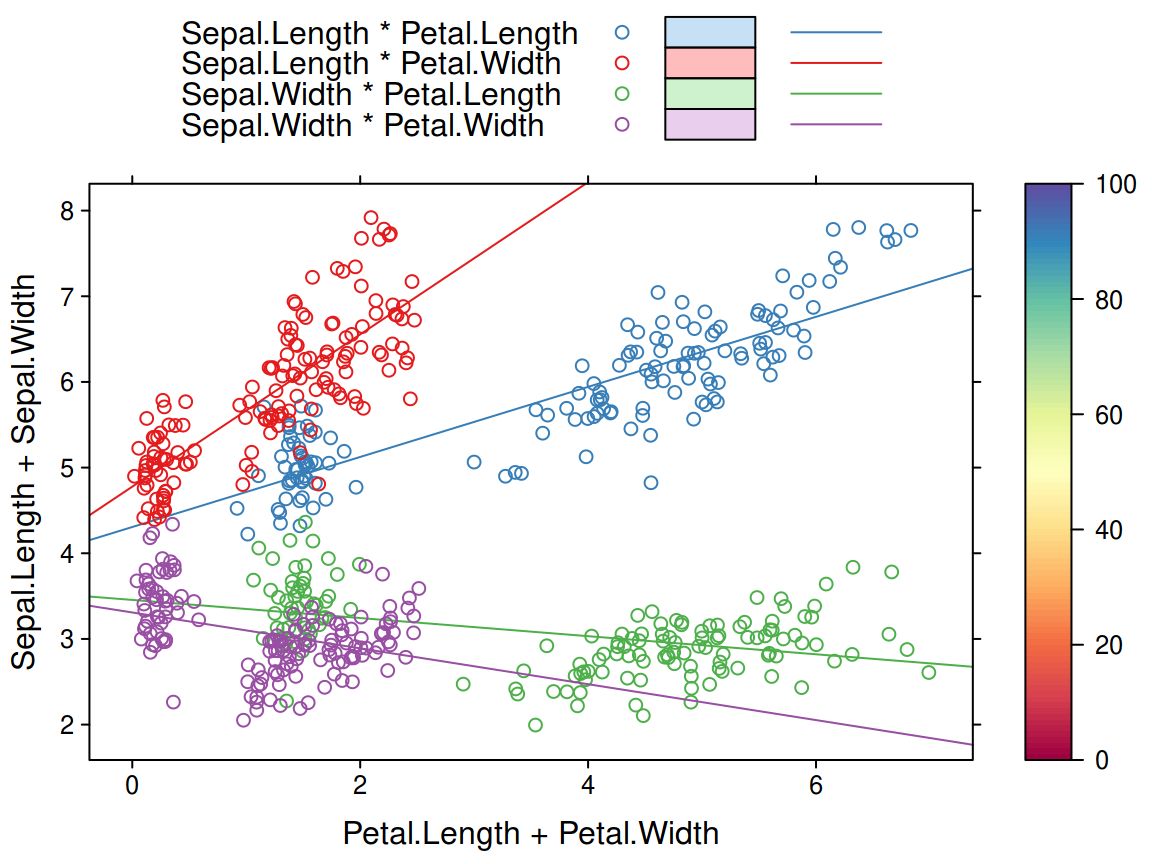
Then we plot a sample plot (from http://latticeextra.r-forge.r-project.org/).
set.seed(0)

## create a plot to demonstrate graphical settings
obj <- xyplot(
  Sepal.Length + Sepal.Width ~ Petal.Length + Petal.Width,
  iris,
  type = c("p", "r"),
  jitter.x = TRUE,
  jitter.y = TRUE,
  factor = 5,
  auto.key = list(lines = TRUE, rectangles = TRUE, space = "top")
)

obj <- update(
  obj,
  legend = list(
    right = list(
      fun = "draw.colorkey",
      args = list(list(at = 0:100))
    )
  )
)

## draw with default theme
obj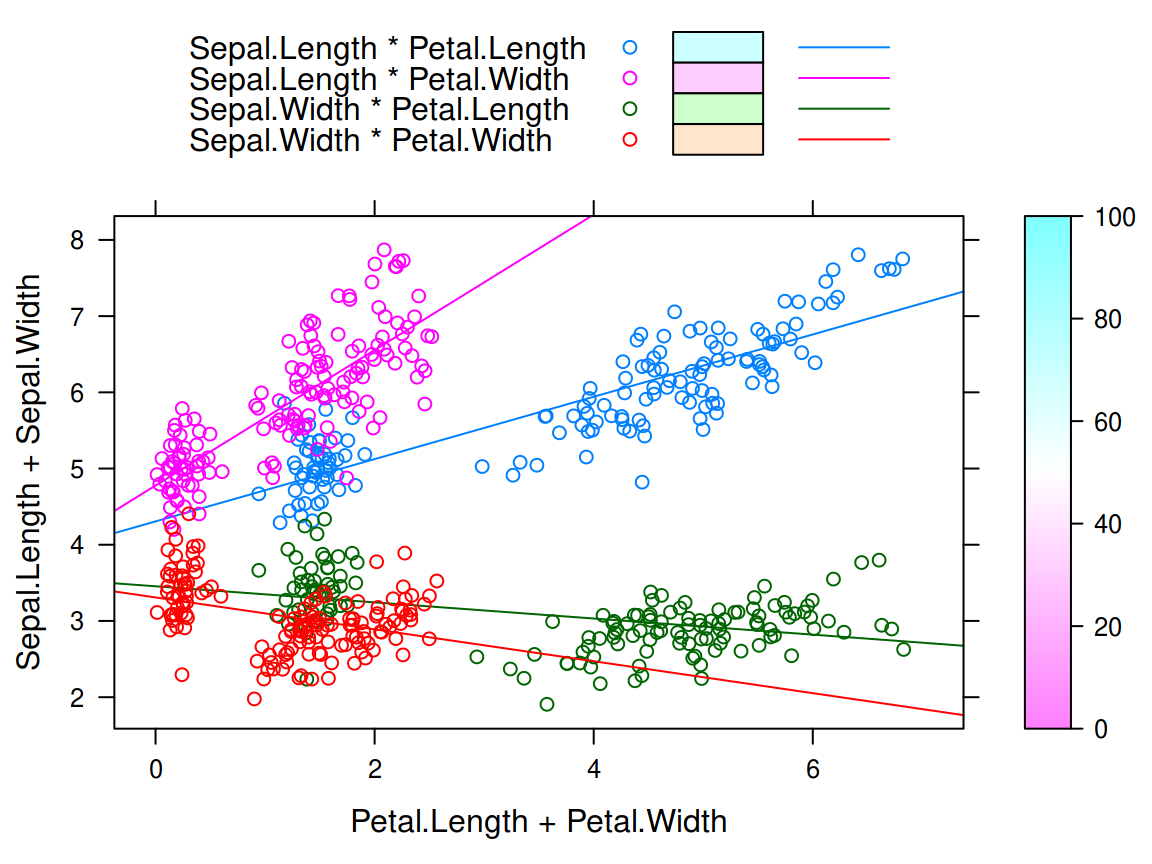
## draw with tactile.theme()
update(obj, par.settings = tactile.theme())