New panel functions
tactile
Johan Larsson
2025-12-15
Source:vignettes/new-panel-functions.Rmd
new-panel-functions.Rmdtactile introduces new panel functions to the latticeverse.
panel.ci(): confidence intervals
panel.ci() adds confidence bands around a line using
arguments lower and upper. This is usually of
interested after, for instance, having fitted a model and then made
predictions using that model.
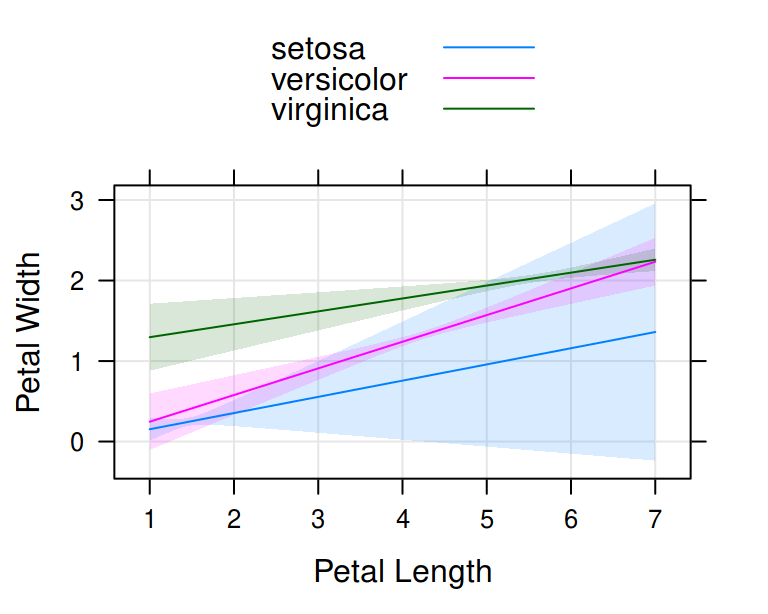
As an example, we will try to predict petal width from petal length
and species, using the iris dataset.
mod <- lm(Petal.Width ~ Petal.Length * Species, data = iris)
newdat <- expand.grid(
  Petal.Length = seq(1, 7, by = 0.1),
  Species = c("setosa", "versicolor", "virginica")
)
pred <- predict(mod, newdat, interval = "confidence")
dd <- cbind(newdat, pred)
Having predicted values across our grid, we now plot the predictions, including 95% confidence levels using the following lines.
library(tactile)
#> Loading required package: lattice
xyplot(fit ~ Petal.Length,
  groups = Species, data = dd,
  prepanel = prepanel.ci, auto.key = list(lines = TRUE, points = FALSE),
  ylab = "Petal Width",
  xlab = "Petal Length",
  lower = dd$lwr,
  upper = dd$upr,
  type = "l",
  panel = function(...) {
    panel.ci(..., alpha = 0.15, grid = TRUE)
    panel.xyplot(...)
  }
)
Example of using panel.ci.
Also note the use of the prepanel.ci() function that we
provide the prepanel argument with so that the axis limits
are set properly.
panel.qqmathci(): confidence intervals for
lattice::qqmath()
panel.qqmathci() is designed to be used together with
lattice::qqmath() and
lattice::panel.qqmathline() to provide confidence intervals
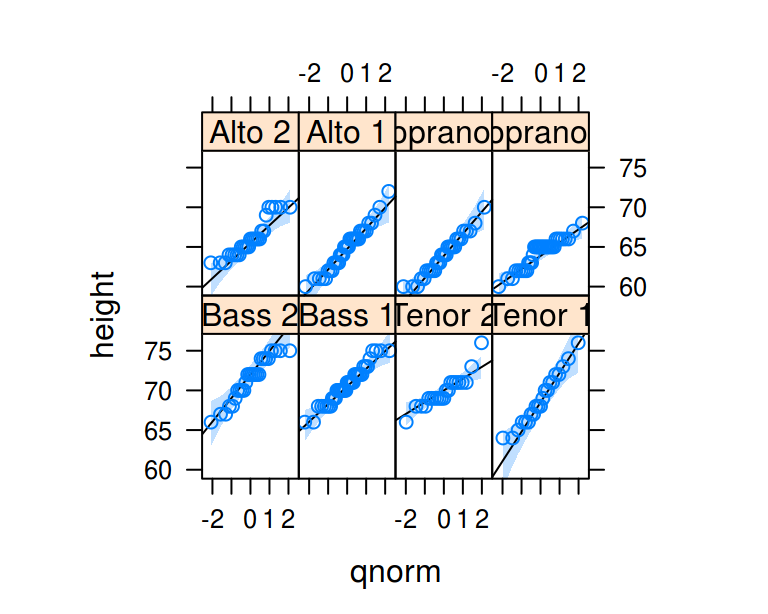
for the theoretical quantities. A rather contrived example follows.
qqmath(~ height | voice.part,
  aspect = "xy", data = singer,
  prepanel = prepanel.qqmathline,
  distribution = qnorm,
  ci = 0.9,
  panel = function(x, ...) {
    panel.qqmathci(x, ...)
    panel.qqmathline(x, ...)
    panel.qqmath(x, ...)
  }
)
Example of using panel.qqmathci.