Draws bubbleblots – trivariate plots where the third dimension is mapped to the size of the points drawn on the screen.
Usage
bubbleplot(x, data = NULL, ...)

# S3 method for class 'formula'
bubbleplot(
  x,
  data = NULL,
  maxsize = 3,
  bubblekey = TRUE,
  panel = panel.bubbleplot,
  groups = NULL,
  subset = TRUE,
  drop.unused.levels = lattice.getOption("drop.unused.levels"),
  ...,
  outer,
  allow.multiple
)
Arguments
- x
A formula of the form
z ~ x * y, wherexandyhave the usual interpretation in trellis graphics (seelattice::xyplot()) andzis mapped to the size of bubbles.- data
A data.frame, list or environment wherein the formula and groups arguments can be evaluated.
- ...
Further arguments to pass to
lattice::xyplot().- maxsize
Maximum size (in cex) for the bubbles.
- bubblekey
Set to
TRUEto draw an informative legend about the bubbles. Useslattice::draw.key(). See the key section of the documentation inlattice::xyplot(). If bothauto.keyandbubblekeyare given and theirspacearguments (positions) conflict, bubblekey will silently override the position ofauto.key.- panel
See
lattice::xyplot(). Here, we are passing an additional variable,z, which is then used inpanel.bubbleplot().- groups
- subset
- drop.unused.levels
- outer
Ignored.
- allow.multiple
Ignored.
Value
An object of class "trellis". The
update method can be used to
update components of the object and the
print method (usually called by
default) will plot it on an appropriate plotting device.
Examples
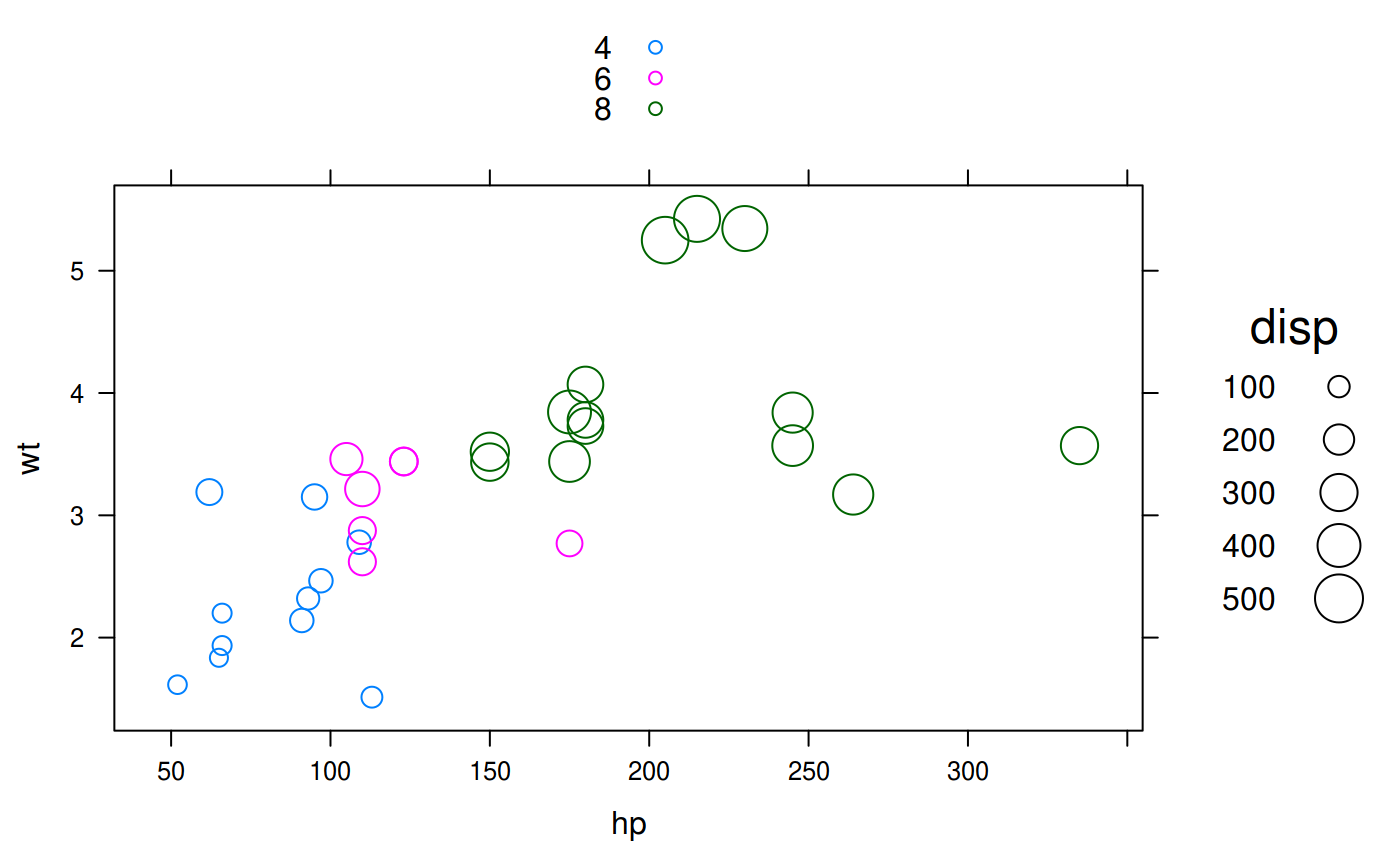
bubbleplot(disp ~ hp * wt, groups = cyl, data = mtcars, auto.key = TRUE)
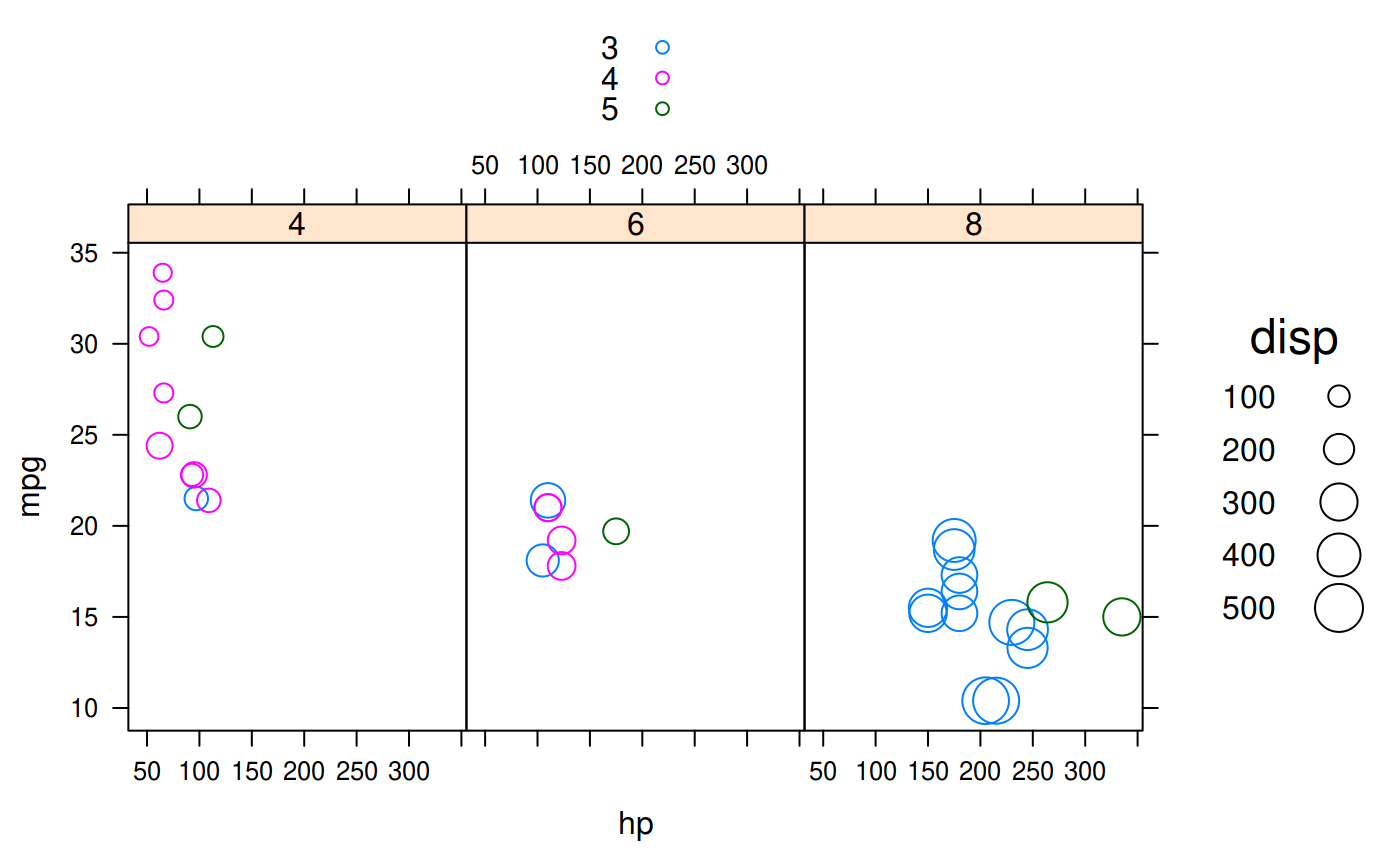
 bubbleplot(disp ~ hp * mpg | factor(cyl), groups = gear, data = mtcars,
auto.key = TRUE)
bubbleplot(disp ~ hp * mpg | factor(cyl), groups = gear, data = mtcars,
auto.key = TRUE)