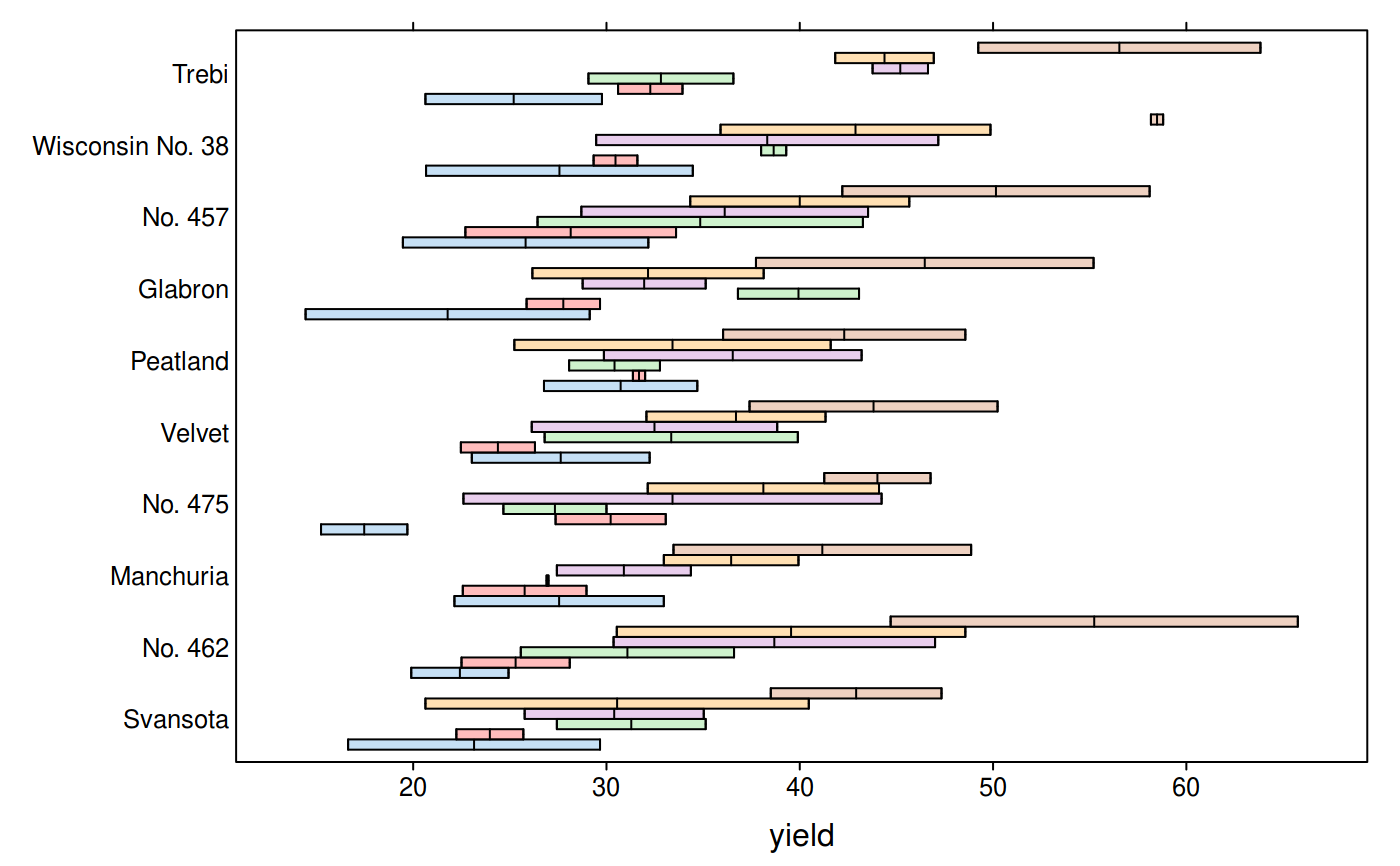
An extended version of lattice::bwplot(). The only modification is to
group and stack box plots if groups is provided.
Usage
bwplot2(x, data = NULL, ...)

# S3 method for class 'formula'
bwplot2(
  x,
  data = NULL,
  allow.multiple = is.null(groups) || outer,
  outer = FALSE,
  auto.key = FALSE,
  groups = NULL,
  drop.unused.levels = lattice.getOption("drop.unused.levels"),
  ...,
  subset = TRUE
)

# S3 method for class 'numeric'
bwplot2(x, data = NULL, xlab = deparse(substitute(x)), ...)
Arguments
- x
- data
- ...
arguments passed down to
lattice::bwplot()- allow.multiple
- outer
- auto.key
- groups
- drop.unused.levels
- subset
- xlab
Value
An object of class "trellis". The
update method can be used to
update components of the object and the
print method (usually called by
default) will plot it on an appropriate plotting device.
Examples
bwplot2(variety ~ yield,
        groups = site,
        data = barley,
        par.settings = tactile.theme())