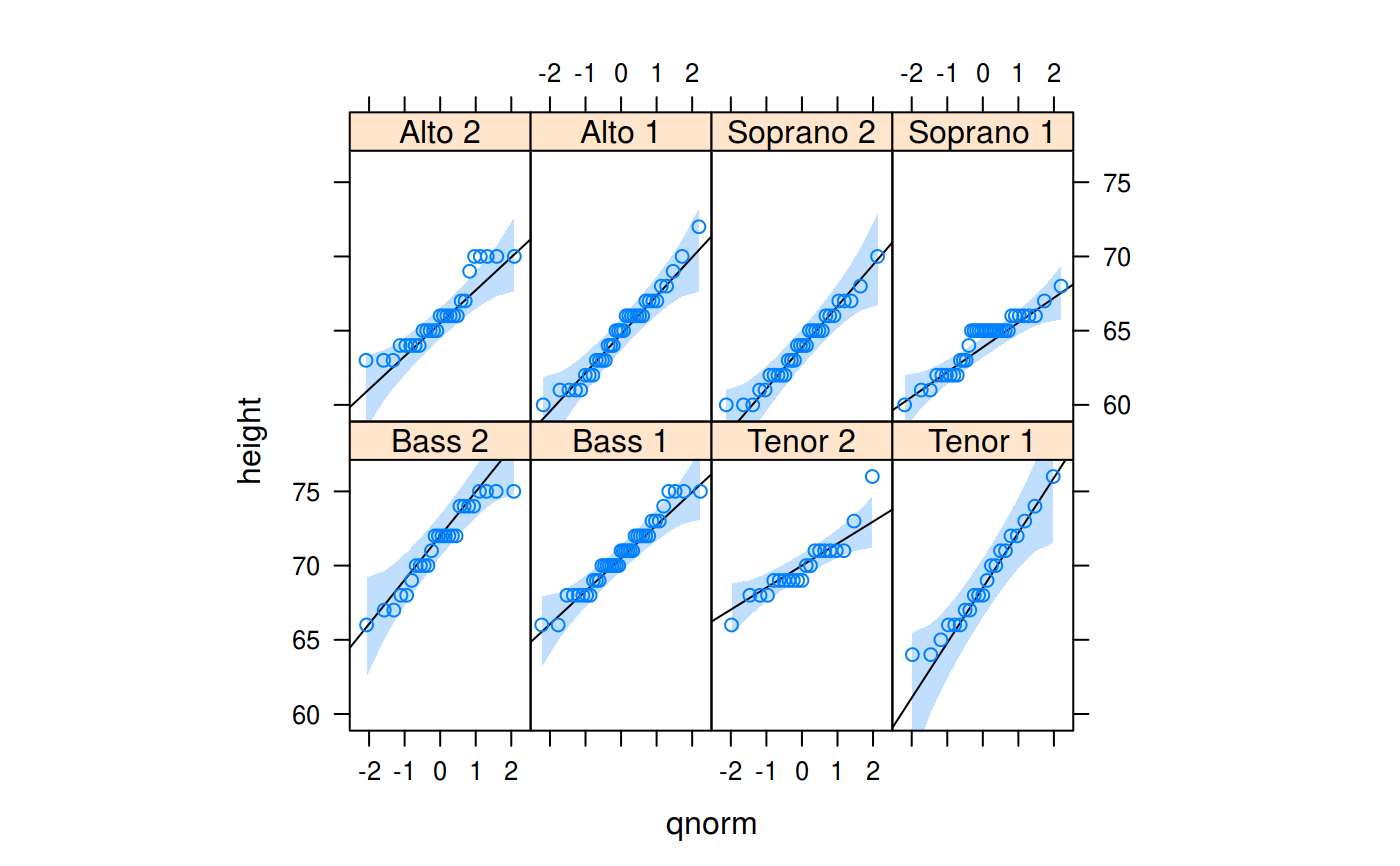
Panel function to go along with lattice::qqmath() and
lattice::panel.qqmathline(). Adds filled confidence bands to the Q-Q-plot.
Usage
panel.qqmathci(
  x,
  y = x,
  distribution = qnorm,
  probs = c(0.25, 0.75),
  qtype = 7,
  groups = NULL,
  ci = 0.95,
  alpha = 0.25,
  col = trellis.par.get("plot.line")$col,
  ...,
  col.line
)
Arguments
- x
The original sample, possibly reduced to a fewer number of quantiles, as determined by the
f.valueargument toqqmath- y
an alias for
xfor backwards compatibility- distribution
quantile function for reference theoretical distribution.
- probs
numeric vector of length two, representing probabilities. Corresponding quantile pairs define the line drawn.
- qtype
the
typeof quantile computation used inquantile- groups
optional grouping variable. If non-null, a line will be drawn for each group.
- ci
Confidence level
- alpha
Alpha level for the color fill
- col
Color fill for the confidence bands.
- ...
Arguments passed to
lattice::panel.superpose()andlattice::panel.polygon()- col.line
Color fill for the confidence bands. Is used internally by
lattice::panel.superpose()and should generally not be changed.
Value
Augments a trellis plot panel, such as that
created by lattice::qqmath(), with confidence levels.
Details
The function tries to figure out the density function counterpart to
that provided in the argument distribution by regular expressions.