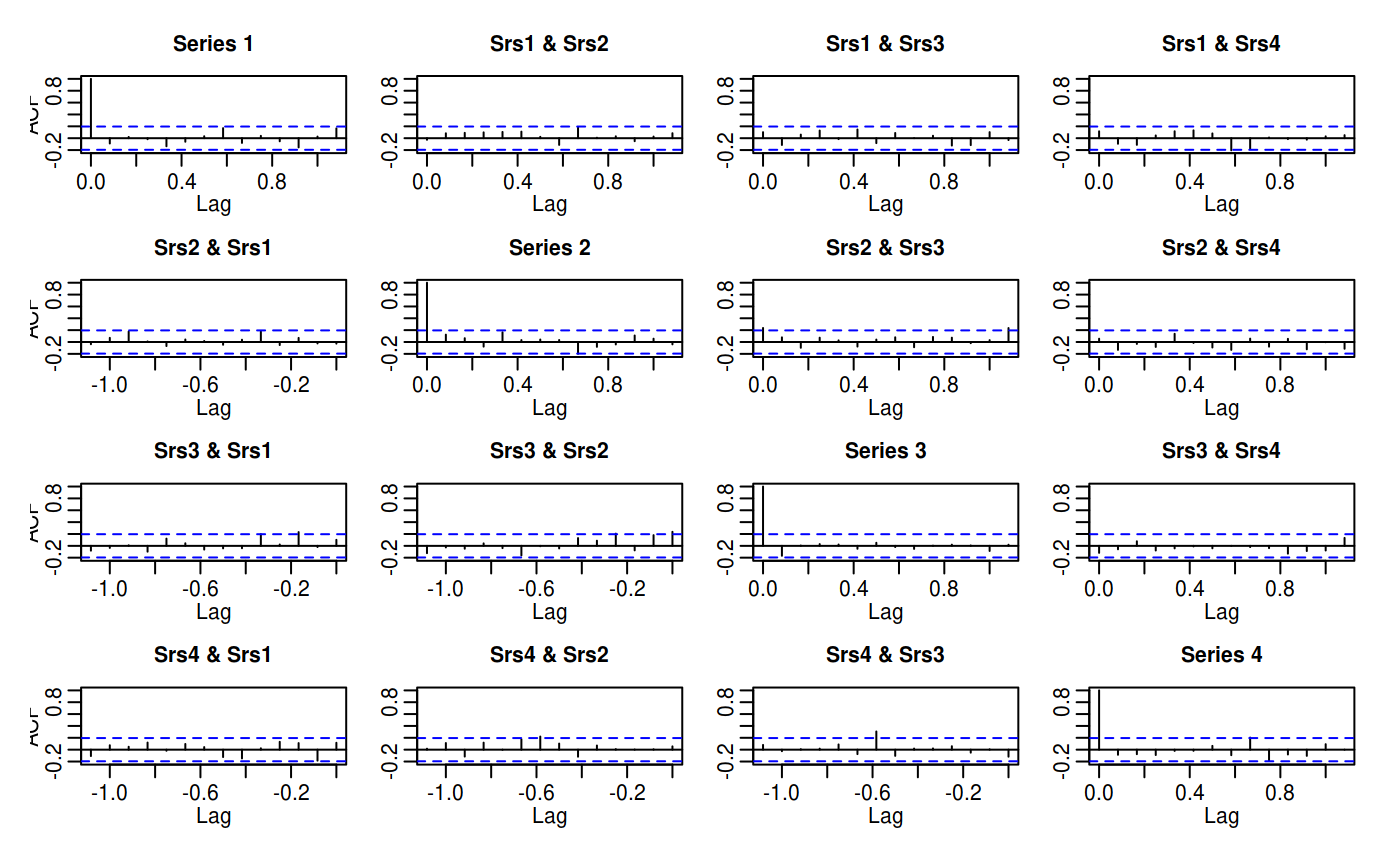
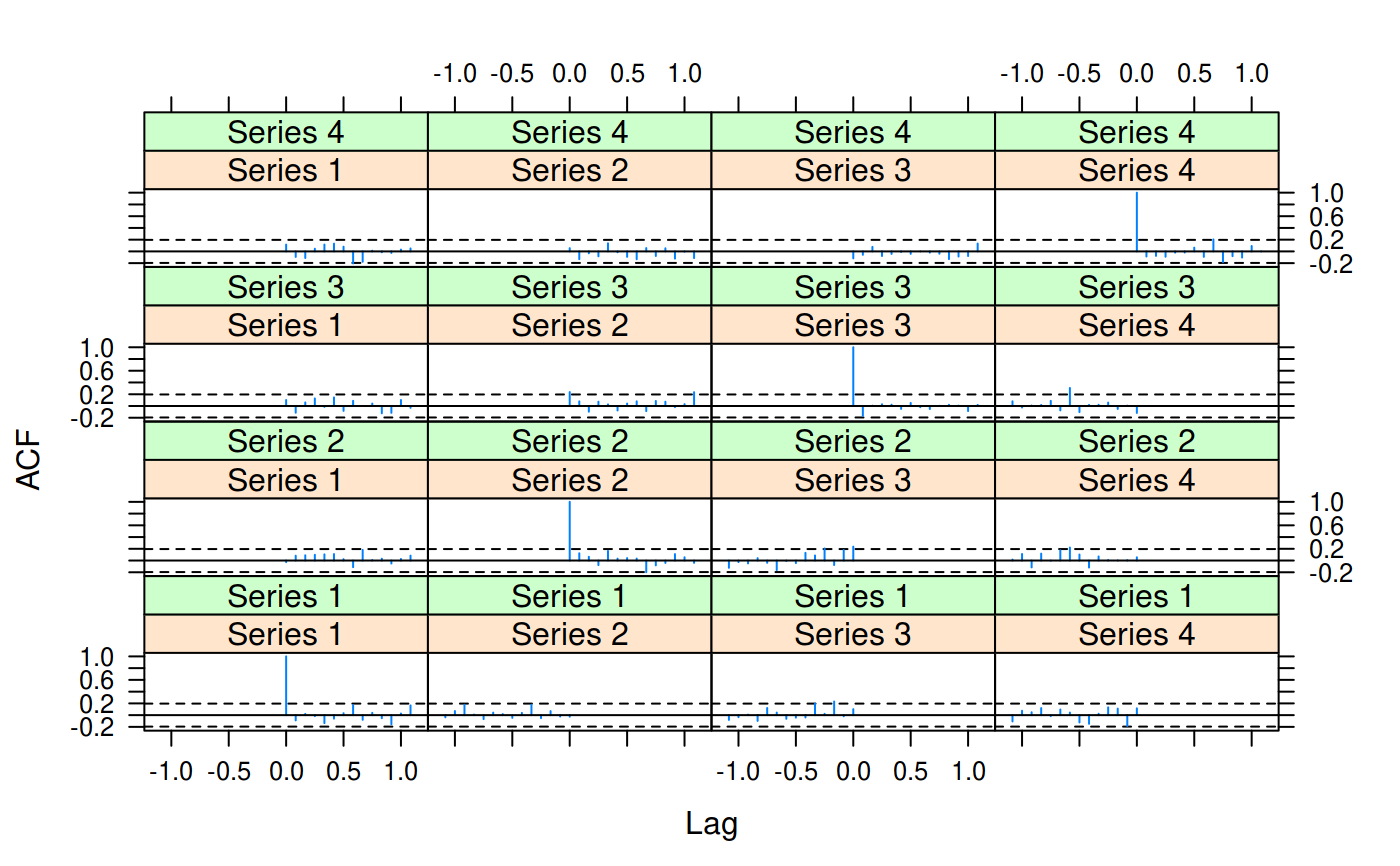
This is a version of stats::plot.acf().
Usage
# S3 method for class 'acf'
xyplot(
  x,
  data = NULL,
  ci = 0.95,
  ci_type = c("white", "ma"),
  ci_col = trellis.par.get("add.line")$col,
  ci_lty = 2,
  ...
)
Arguments
- x
An 'acf' object.
- data
Ignored
- ci
Confidence level.
- ci_type
Type of confidence level.
- ci_col
Line color for the confidence levels.
- ci_lty
Line type for the confidence levels.
- ...
Arguments passed on to
lattice::xyplot().