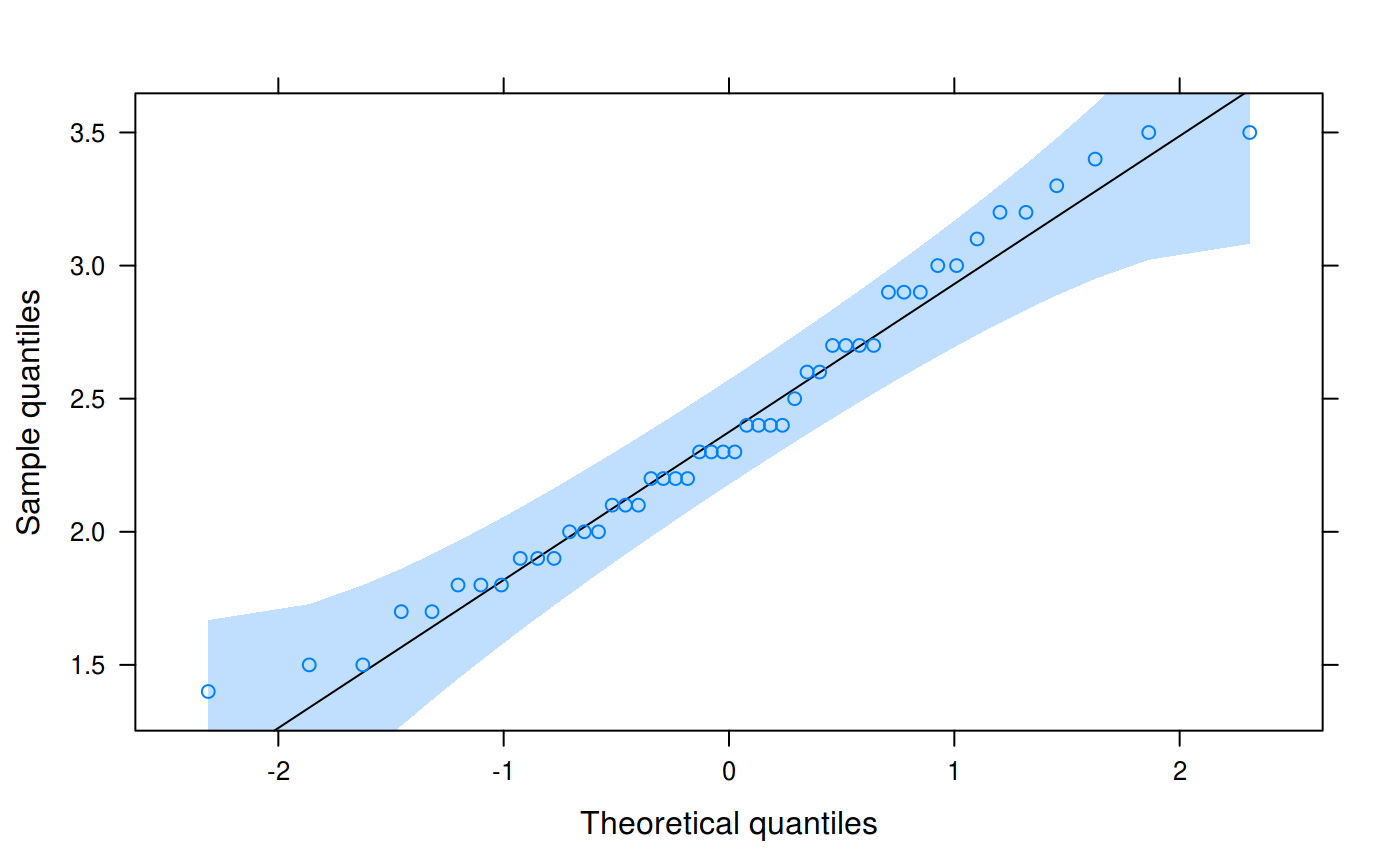
Draw quantile-Quantile plots of a sample against a theoretical distribution, possibly conditioned on other variables.
Usage
# S3 method for class 'zoo'
qqmath(
  x,
  data = NULL,
  xlab = "Theoretical quantiles",
  ylab = "Sample quantiles",
  ref = TRUE,
  ci = TRUE,
  ...
)
Arguments
- x
A
zooobject- data
Ignored
- xlab
X axis label
- ylab
Y axis label
- ref
Plot a reference line via
lattice::panel.qqmathline().- ci
Plot confidence levels via
panel.qqmathci().- ...
Parameters to pass on to
lattice::qqmath().