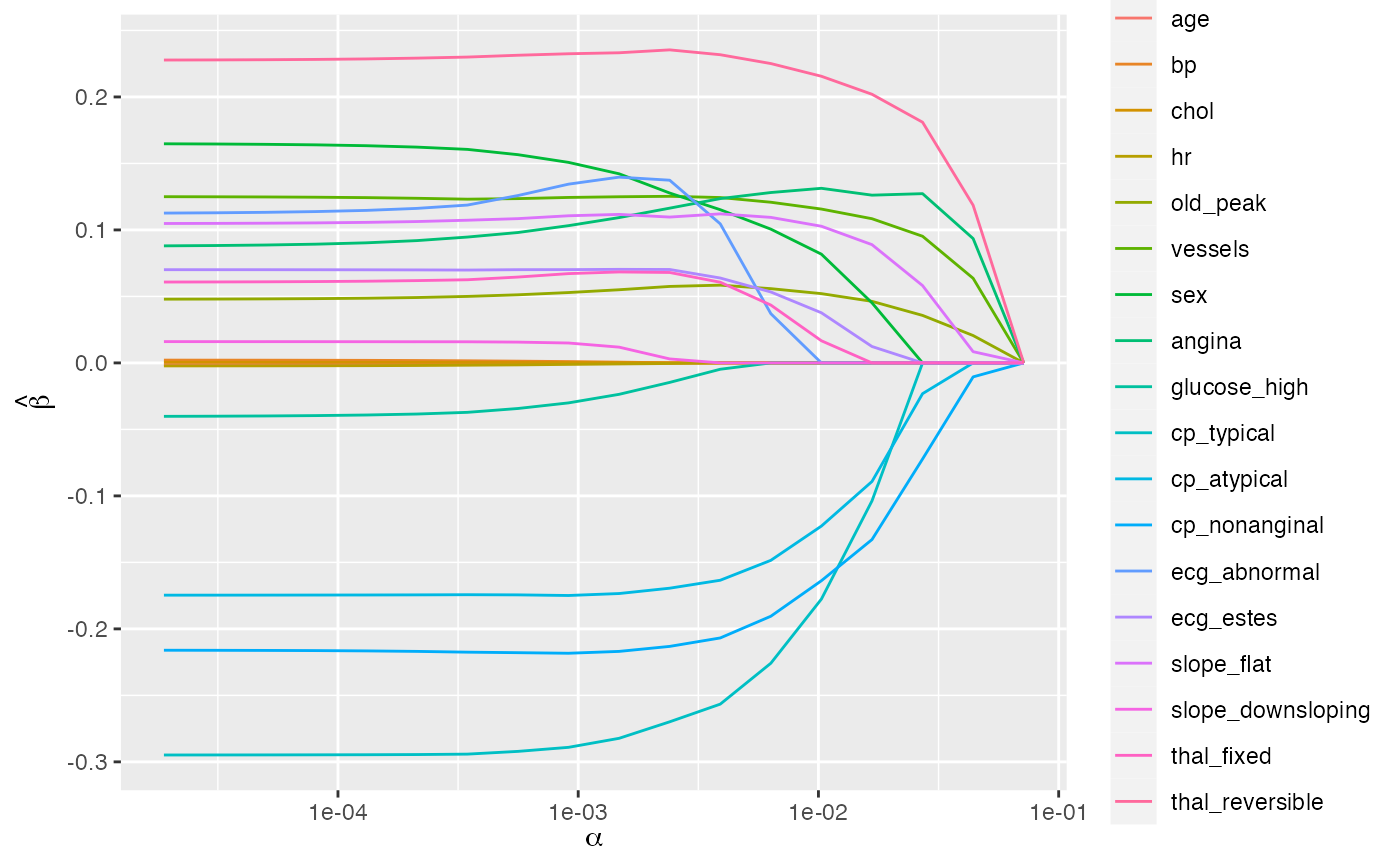
Plot the fitted model's regression coefficients along the regularization path.
Arguments
- x
an object of class
"SLOPE"- intercept
whether to plot the intercept
- x_variable
what to plot on the x axis.
"alpha"plots the scaling parameter for the sequence,"deviance_ratio"plots the fraction of deviance explained, and"step"plots step number.- ...
further arguments passed to or from other methods.
Value
An object of class "ggplot", which will be plotted on the
current device unless stored in a variable.
See also
Other SLOPE-methods:
coef.SLOPE(),
deviance.SLOPE(),
predict.SLOPE(),
print.SLOPE(),
score()
