eulerr features multiple loss functions, which result in different diagrams for many combinations. In this vignette, we visualize the effect of the loss function on an example from an issue posted on the GitHub repository for eulerr.
We list the combinations below, which consists of 5 different sets, agc, camk, cmgc, and tk.
combos <- c(
  "agc" = 9,
  "camk" = 17,
  "cmgc" = 16,
  "tk" = 16,
  "tkl" = 23,
  "agc&camk" = 1,
  "camk&tk" = 1,
  "tk&tkl" = 1,
  "camk&cmgc&tkl" = 1,
  "camk&tk&tkl" = 2,
  "agc&camk&tk&tkl" = 1,
  "camk&cmgc&tk&tkl" = 3,
  "agc&camk&cmgc&tk&tkl" = 1
)
Notice that the sizes of most of the intersections are small compared to the size of the sets themselves and that many of the intersections are missing. Generating an exact Euler diagram that shows these intersections and at the same time omits the intersections that are here implicitly 0 is an impossible problem, which means that the best we can do is an approximation.
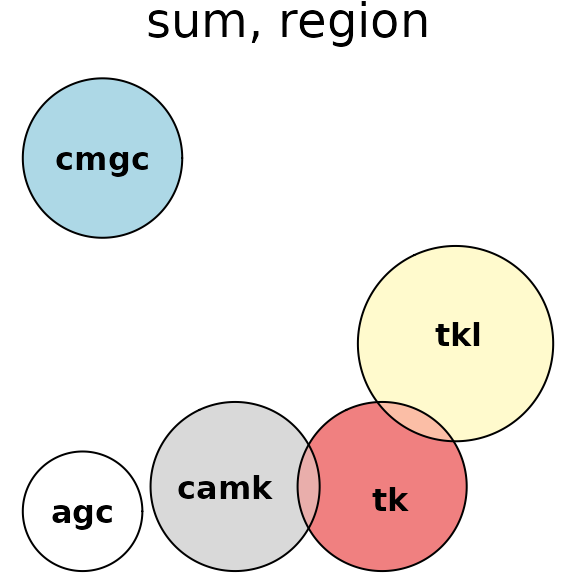
What kind of approximation we get depends on the loss functions we use. If we use the default, which in eulerr is the sums of squared errors, we will almost certainly get a design in which the intersections involving many sets are missing since including them inevitably leads to larger errors from having to include other intersections that are not present.
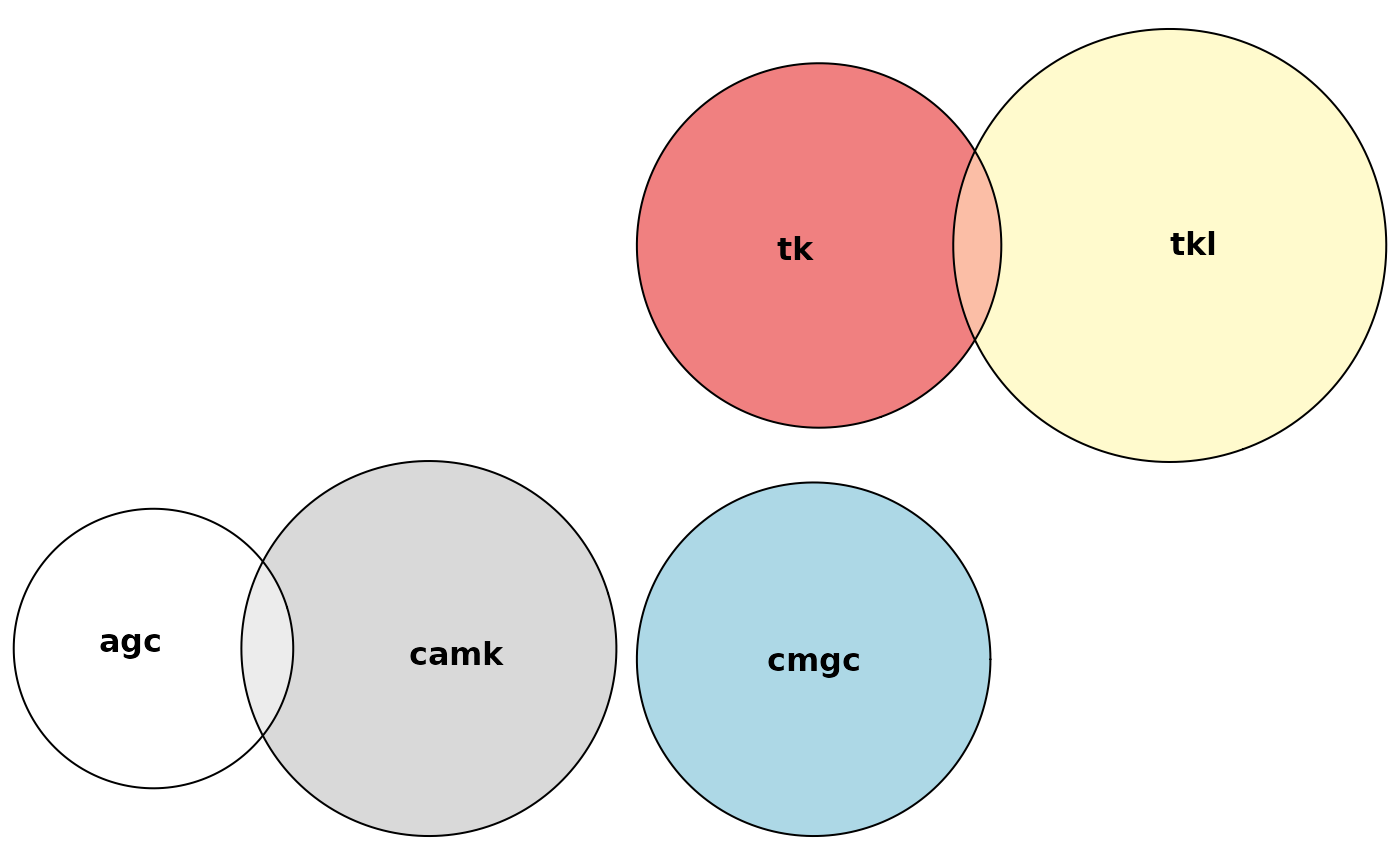
An Euler diagram fit to the combination given earlier on, showing that only 1-by-1 intersections are present. This fit uses the default loss function, the sum of squared errors.
If we rather want a diagram that includes these intersections,
despite leading to errors for the zero-intersections, then we need to
switch the loss function we use. In eulerr, you can do
so via the loss argument in euler(), which
mirrors the loss functions provided by the underlying
eunoia Rust crate.
| Loss | Input | Definition |
|---|---|---|
| Sum of squared errors |
sum_squared (default) |
|
| Sum of absolute errors | sum_absolute |
|
| Sum of squared regErrors | sum_squared_region_error |
|
| Sum of absolute regErrors | sum_absolute_region_error |
|
| Max squared error | max_squared |
|
| Max absolute error | max_absolute |
|
| Root-mean-squared error | root_mean_squared |
|
| Stress | stress |
venneuler-style stress |
| diagError | diag_error |
The pre-1.0 loss_aggregator argument is deprecated;
combine the behavior you want into a single loss value
instead. For example loss = "square" together with
loss_aggregator = "sum" is now simply
loss = "sum_squared", and loss = "region" with
loss_aggregator = "max" is
loss = "diag_error".
To see what these different choices mean for the combination that we have looked at, we now refit the diagram for each loss.
losses <- c(
  "sum_squared",
  "sum_absolute",
  "sum_absolute_region_error",
  "max_squared",
  "max_absolute",
  "diag_error"
)

for (loss in losses) {
  fit <- euler(combos, loss = loss)
  print(plot(fit, main = loss))
}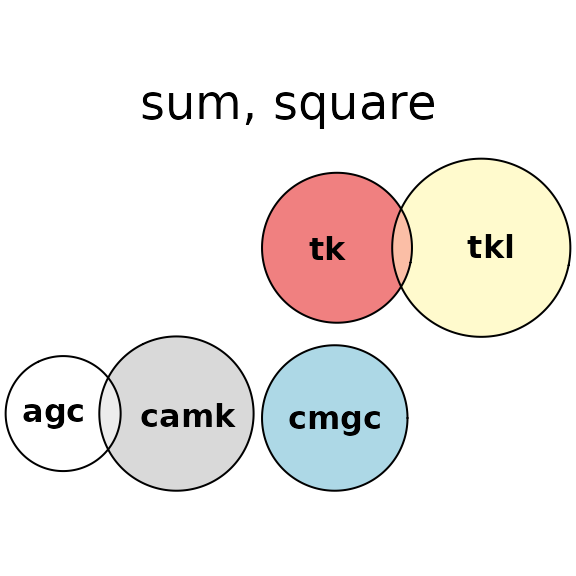
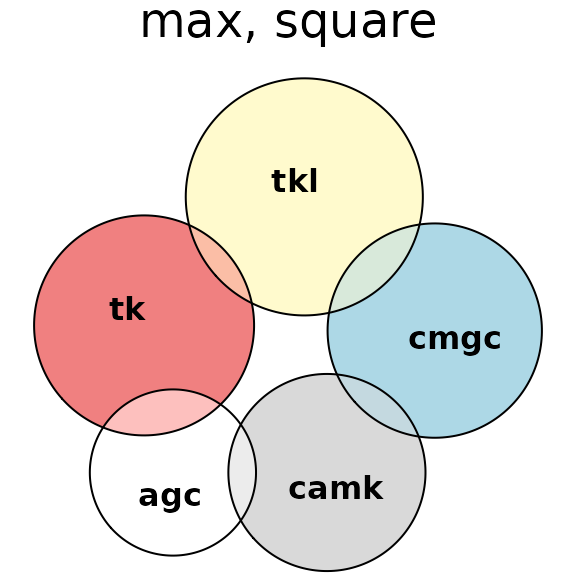
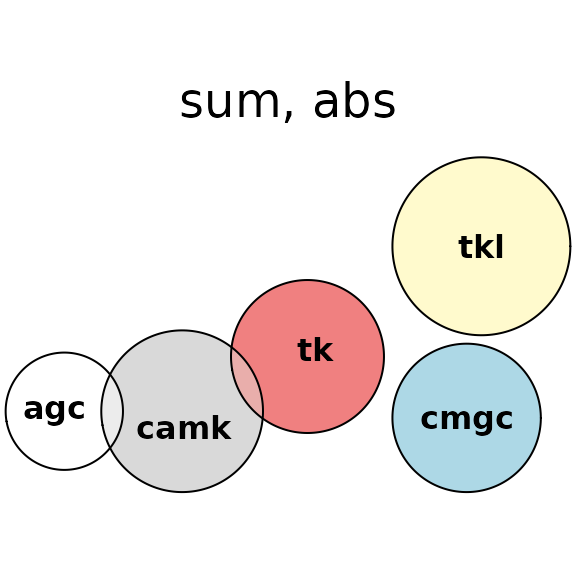
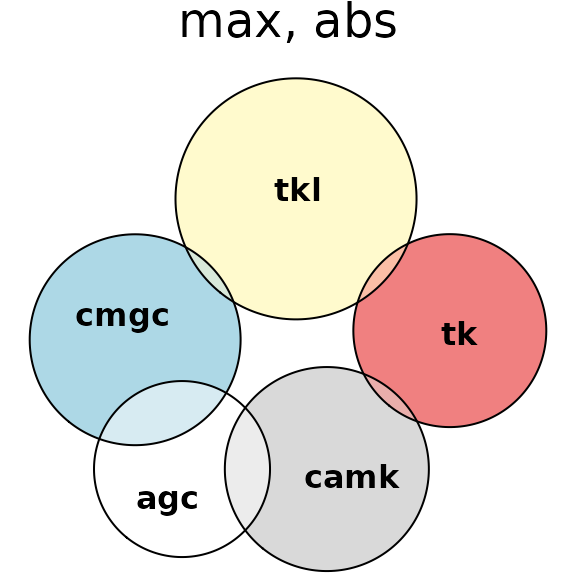
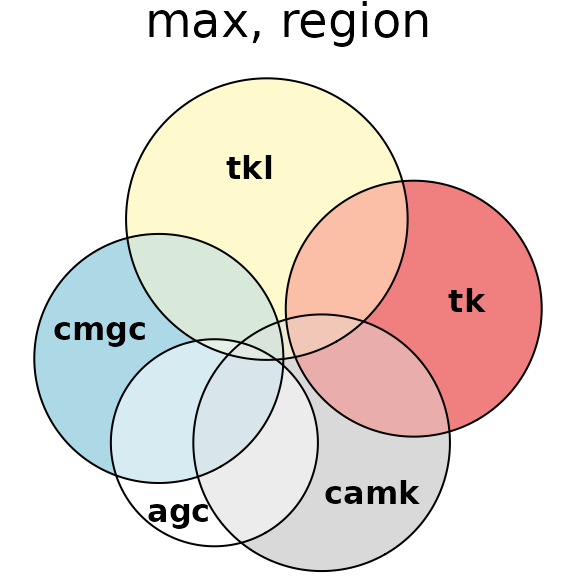
Euler diagrams fit to the combination above, using different loss functions
As you can see, the errors that sum either the absolute or squared
errors result in very similar fits and keep the existing two-set
intersections and drop everything else. The abs +
max and max + square combos,
meanwhile, produce fits that are much more unpredictable since they only
care about the largest error. Finally, diagError results in
diagrams that tries to include many more intersections at the cost of
reducing the goodness-of-fit of the larger intersections.
Feel free to raise a request (or better yet, a pull request) at https://github.com/jolars/eulerr/issues if you know of any other loss function that you think should be included in the package.