This vignette contains benchmarks of sgdnet against other similar packages. The data has been precomputed from scripts that are available at https://github.com/jolars/sgdnet/data-raw/.
The benchmarks were generated as follows:
- We fit with (\(\alpha = 1\)) and ridge (\(\alpha = 0\)) penalties.
- The regularization strength, \(\lambda\), was set to \(\frac1n\) for each fit.
- A log-spaced sequence of tolerance thresholds were generated, which were selected after trial-and-error to ensure that the packages ran over approximately the same time frame.
- The run times were recorded using
system.time(). - The range of run times were clipped to remove “trailing” times to make sure that each the range of times for each package were constrained around the same values.
- Both loss and run times were normalized and the latter were cut into intervals of 20 slices within which the run times were averaged.
The benchmarks were run on a dedicated Amazon EC2 m4.large instance.
Note that some of the data sets below are not strictly 100% dense, despite the specifications below. They are, however, stored in dense matrix form (the regular matrix class in R), which makes the packages ignore any sparsity.
Gaussian least squares ordinary regression
| Name | Observations | Features | Density |
|---|---|---|---|
| abalone | 4,177 | 8 | 100% |
| cadata | 20,640 | 8 | 100% |
| mushroooms | 8,124 | 12 | 100% |
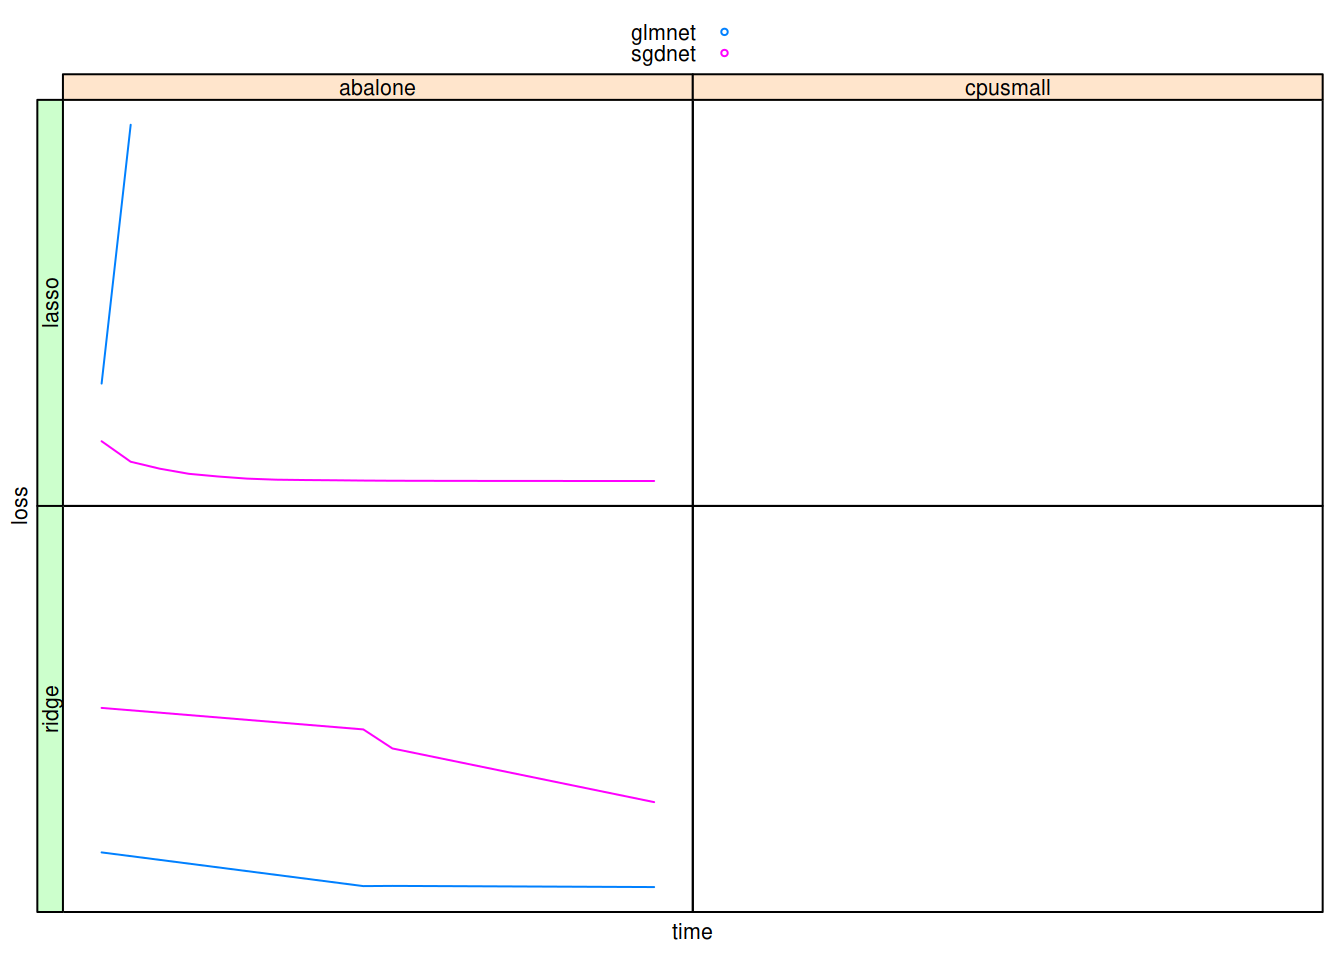
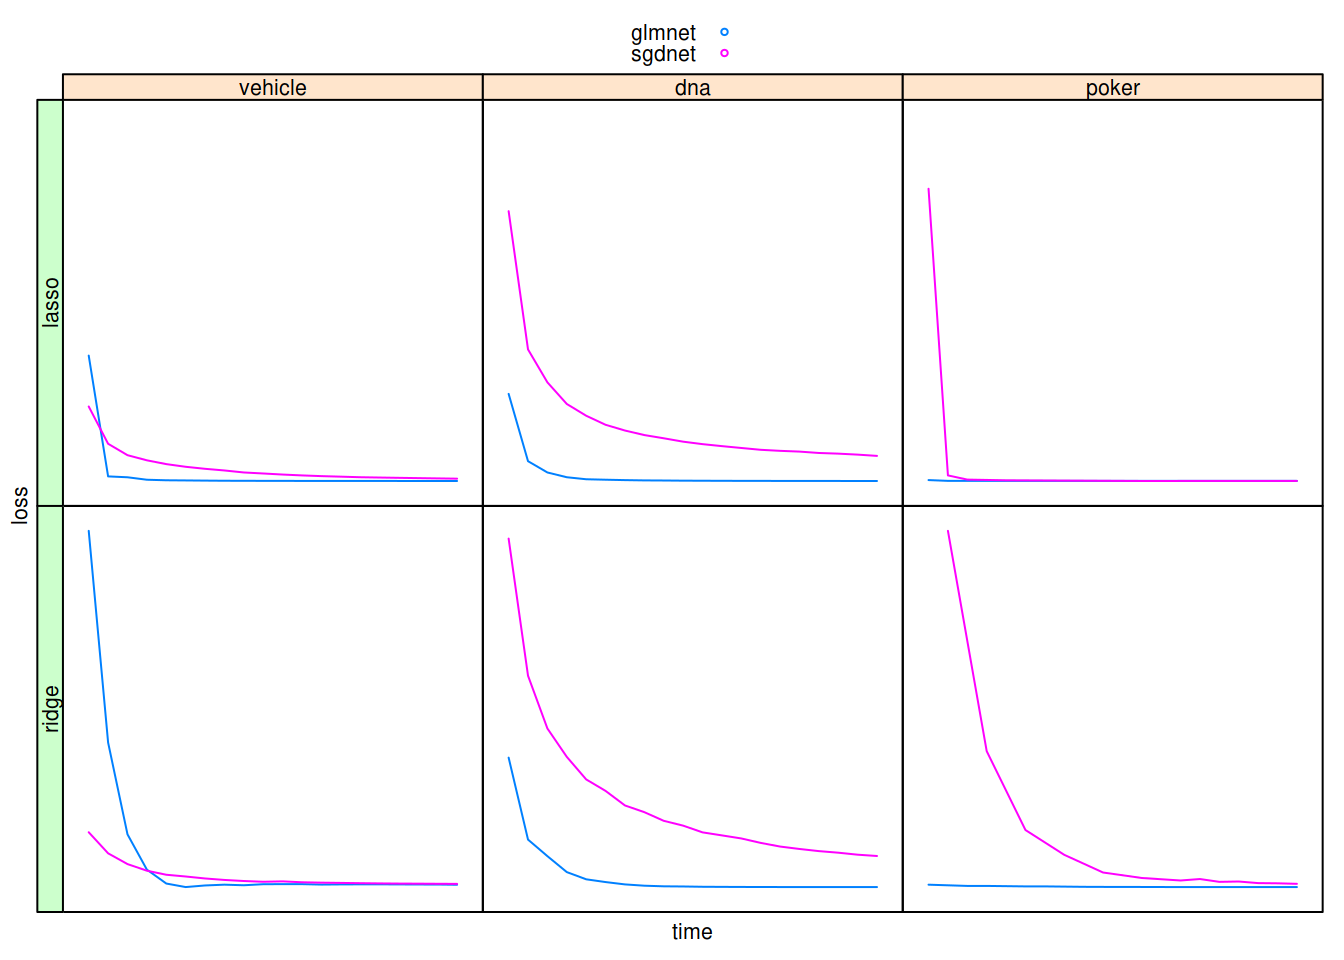
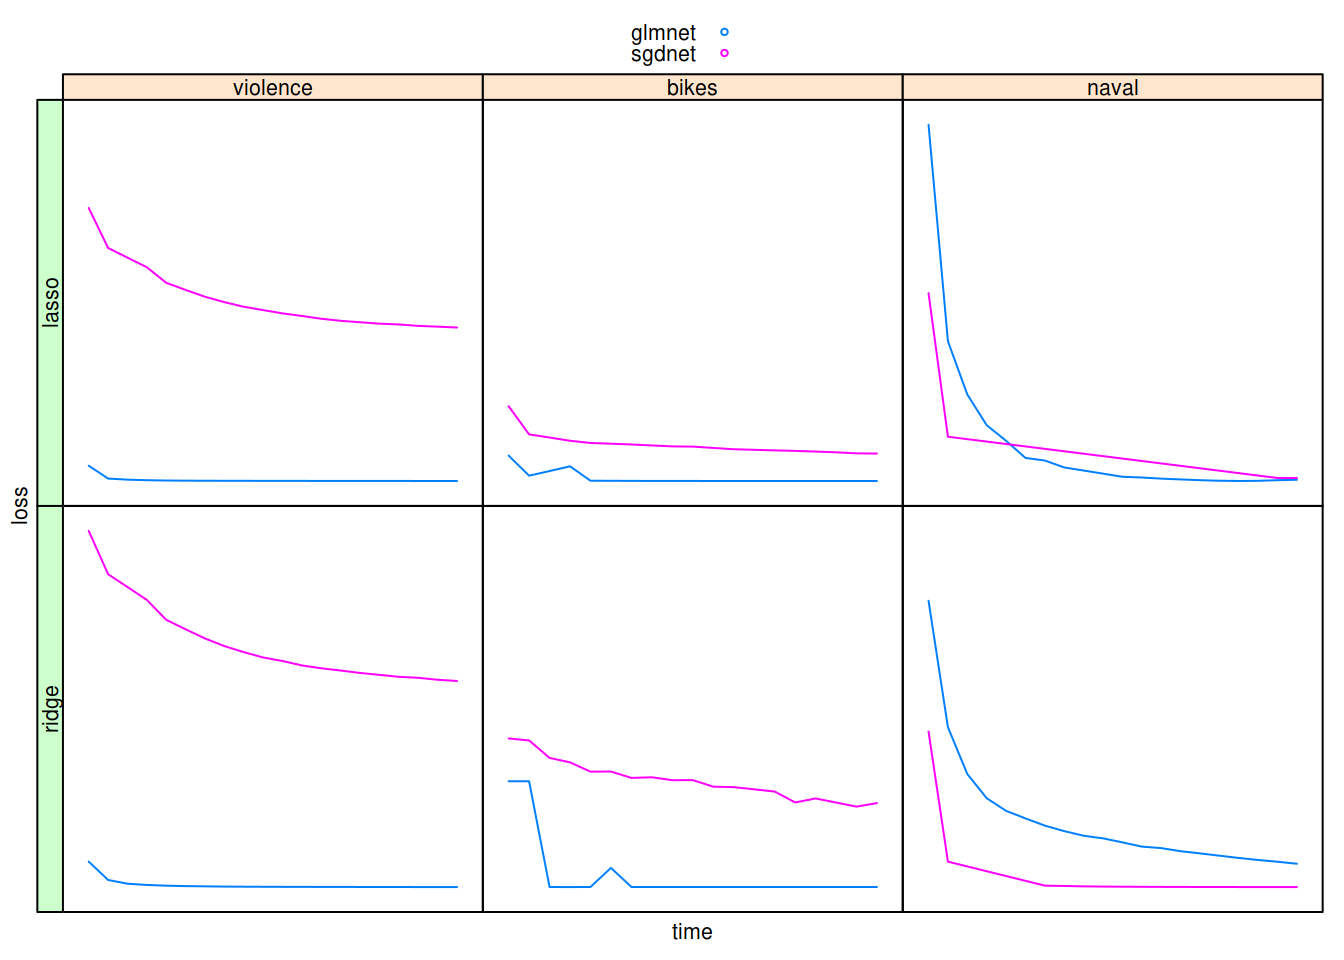
Benchmarking results for gaussian responses.
Binomial logistic regression
In this section, we are going to look at the following datasets:
| Name | Observations | Features | Density |
|---|---|---|---|
| adult | 32,561 | 123 | 11% |
| icjnn1 | 49,990 | 22 | 100% |
| mushroooms | 8,124 | 112 | 19% |
All of these have been collected from the libsvm binary dataset collection.
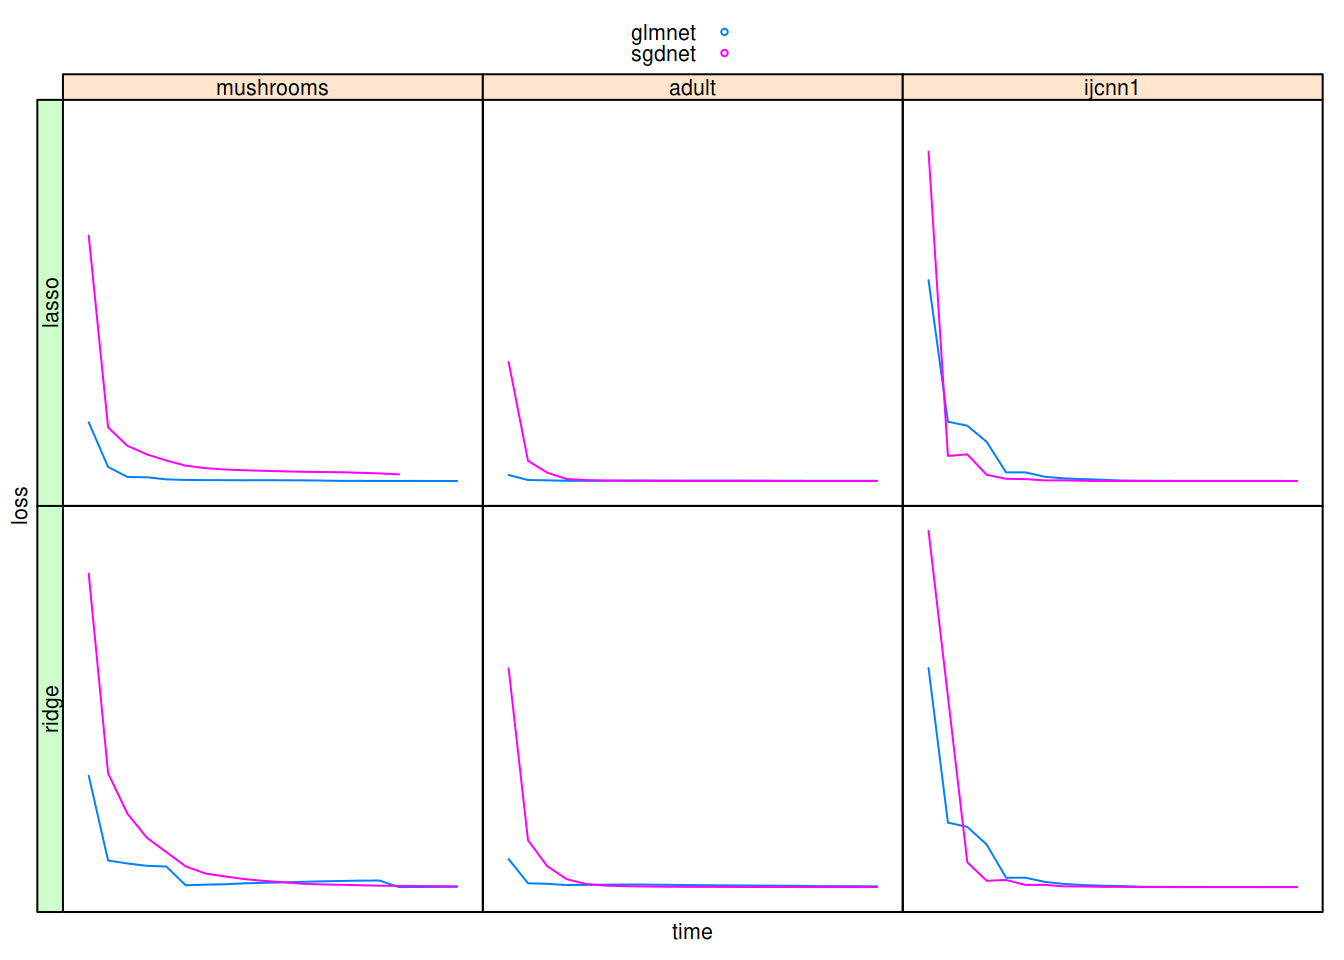
Benchmarking results for binomial responses.