Plot Results from Cross-Validation
# S3 method for cv_sgdnet
plot(x, sign.lambda = 1, plot_min = TRUE,
  plot_1se = TRUE, ci_alpha = 0.2, ci_border = FALSE,
  ci_col = lattice::trellis.par.get("superpose.line")$col, ...)
Arguments
| x | an object of class |
|---|---|
| sign.lambda | the sign of \(\lambda\) |
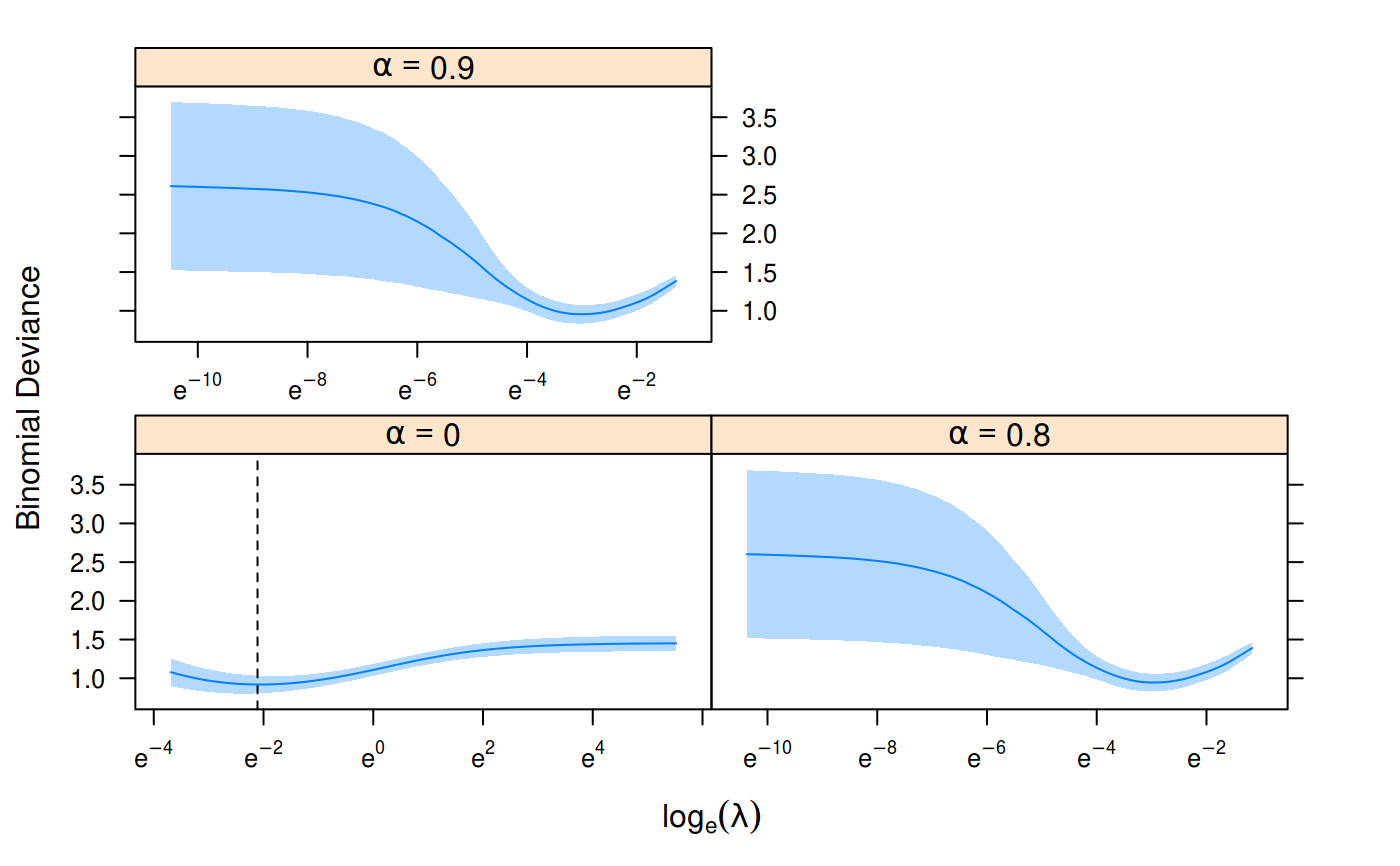
| plot_min | whether to mark the location of the lambda corresponding to the best prediction score |
| plot_1se | whether to mark the location of the largest lambda
within one standard deviation from the location corresponding to |
| ci_alpha | alpha (opacity) for fill in confidence limits |
| ci_border | color (or flag to turn off and on) the border of the confidence limits |
| ci_col | color for border of confidence limits |
| ... | other arguments that are passed on to |
Value
An object of class 'trellis' is returned and, if used
interactively, will most likely have its print function
lattice::print.trellis()) invoked, which draws the plot on the
current display device.
See also
Examples
cv <- cv_sgdnet(heart$x,
                heart$y,
                family = "binomial",
                alpha = c(0, 0.8, 0.9))
plot(cv, ci_alpha = 0.3, plot_1se = FALSE)