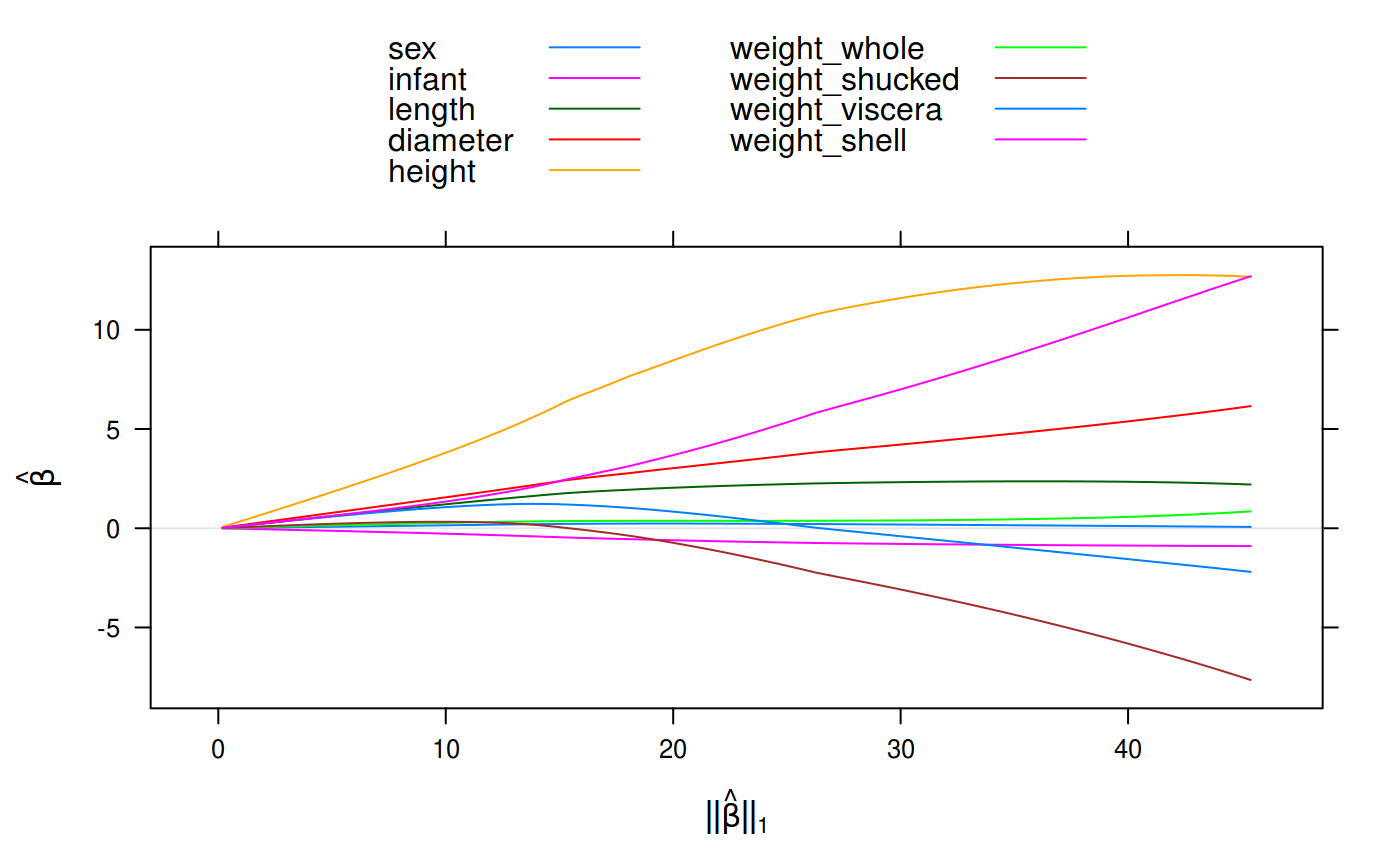
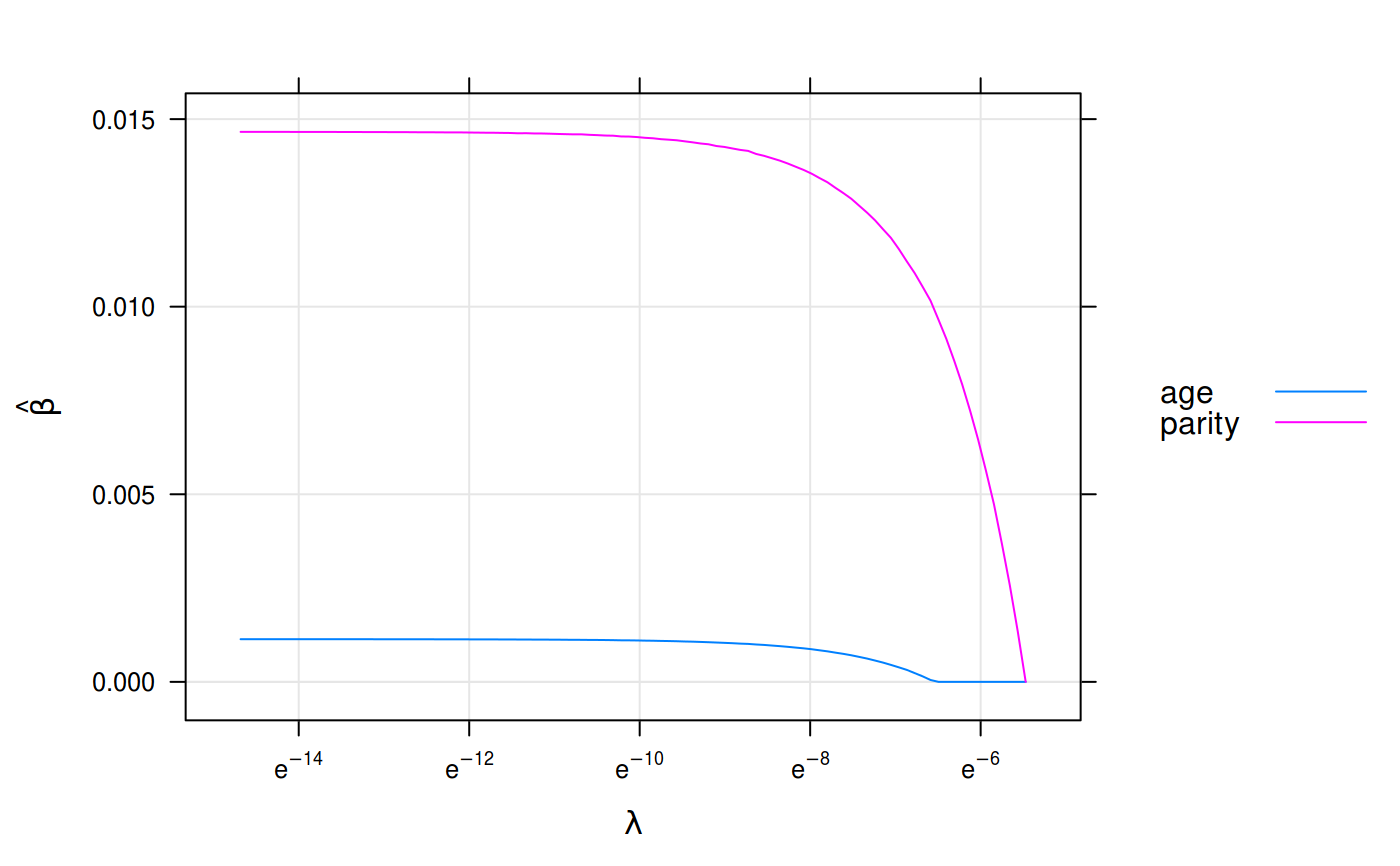
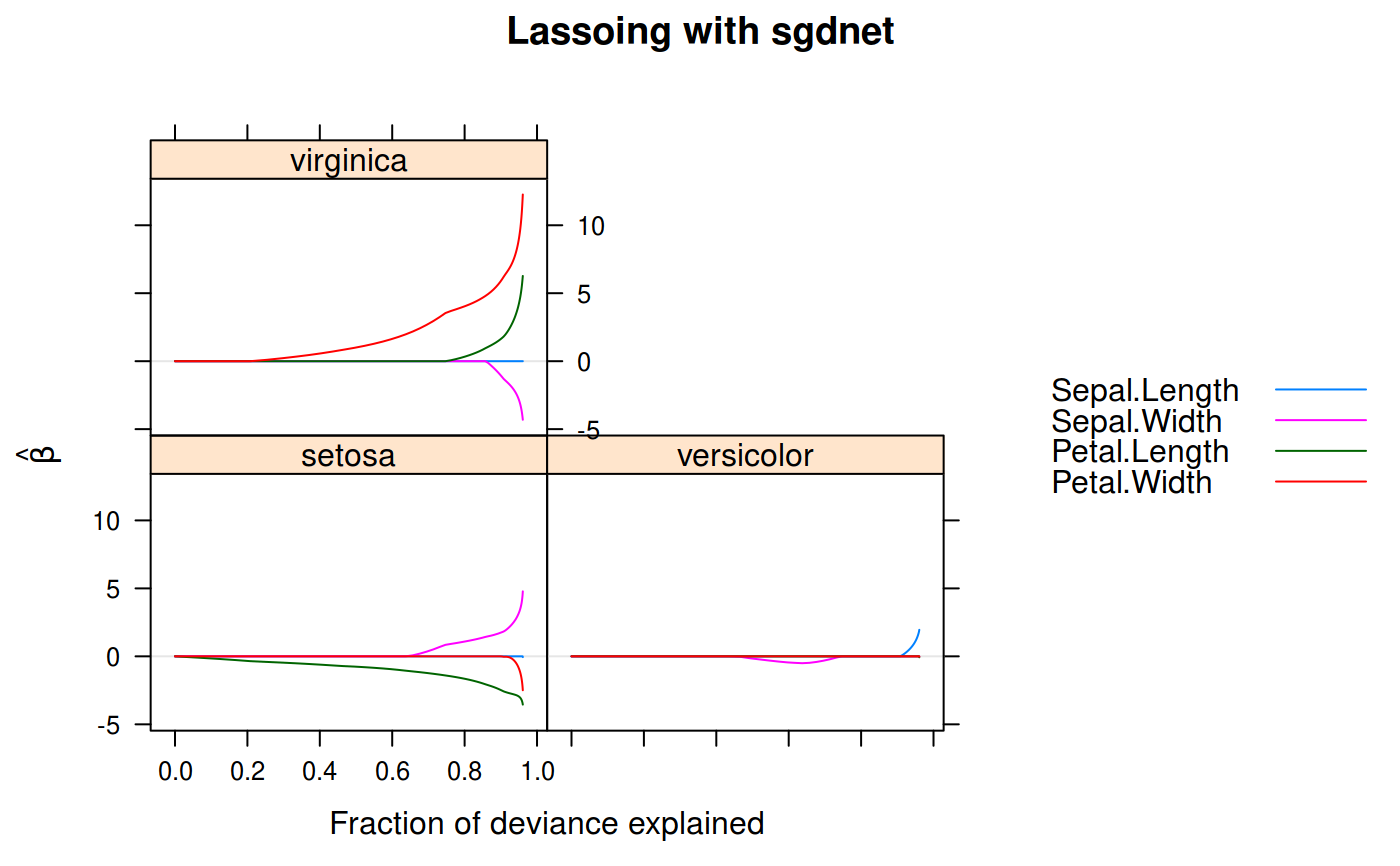
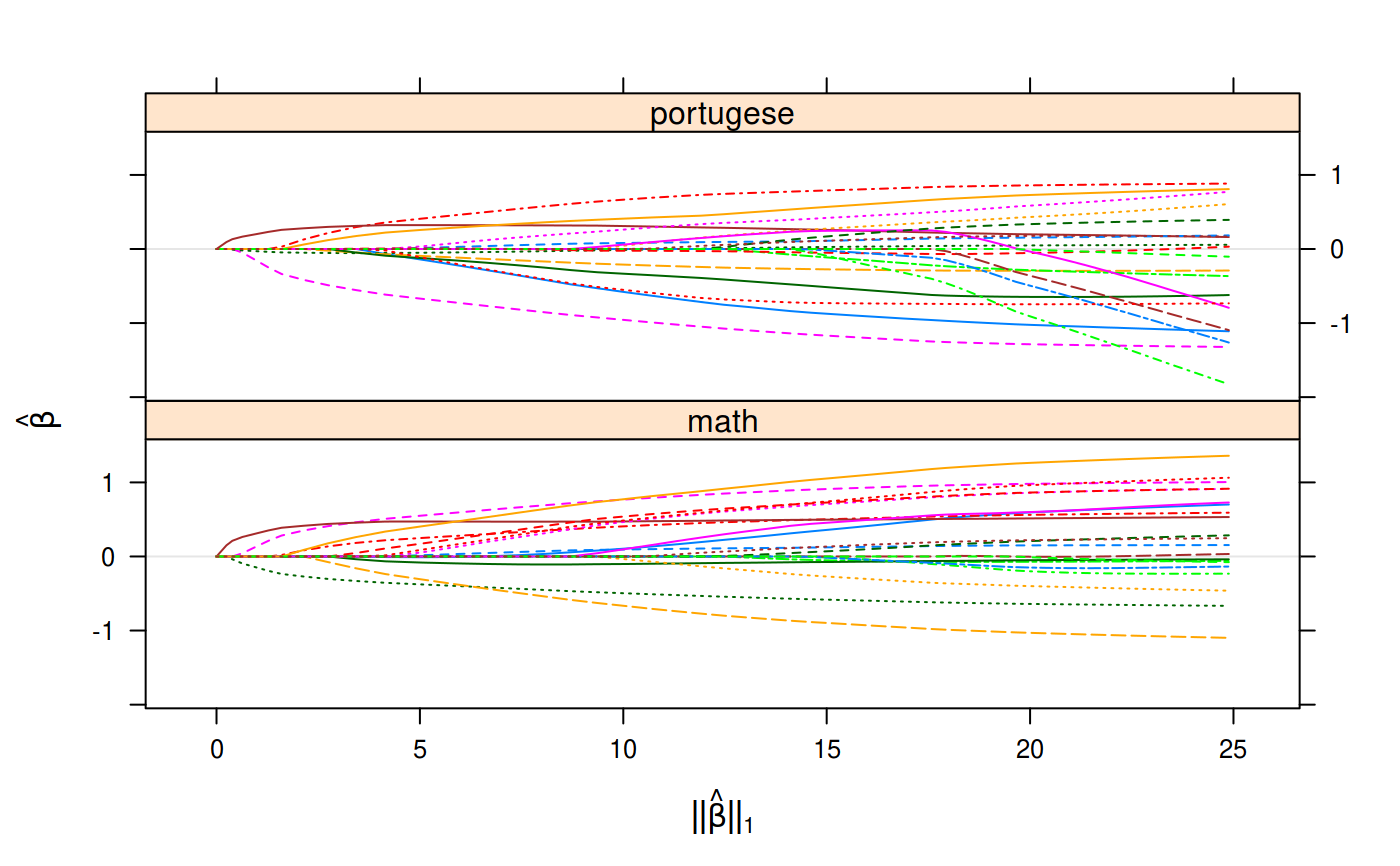
Plot coefficients from an object of class 'sgdnet' against the L1-norm,
lambda penalty, or deviance ratio.
# S3 method for sgdnet
plot(x, xvar = c("norm", "lambda", "dev"), ...)
Arguments
| x | an object of class |
|---|---|
| xvar | value to be plotted on the x axis. |
| ... | parameters passed down to |
Value
A graphical description of class 'trellis', which will be
plotted on the current graphical device in interactive sessions.
Details
This function calls lattice::xyplot() under the hood after having
arranged the plotting data slightly.
See also
Examples
# Gaussian logistic regression gfit <- sgdnet(abalone$x, abalone$y, alpha = 0) plot(gfit, auto.key = list(columns = 2, space = "top"))# Binomial logistic regression bfit <- sgdnet(with(infert, cbind(age, parity)), infert$case, family = "binomial") plot(bfit, xvar = "lambda", grid = TRUE)# Multinomial logistic regression mfit <- sgdnet(iris[, 1:4], iris[, 5], family = "multinomial") plot(mfit, xvar = "dev", main = "Lassoing with sgdnet")# Multivariate gaussian regression mgfit <- sgdnet(student$x, student$y, family = "mgaussian") plot(mgfit, lty = 1:9, layout = c(1, 2))