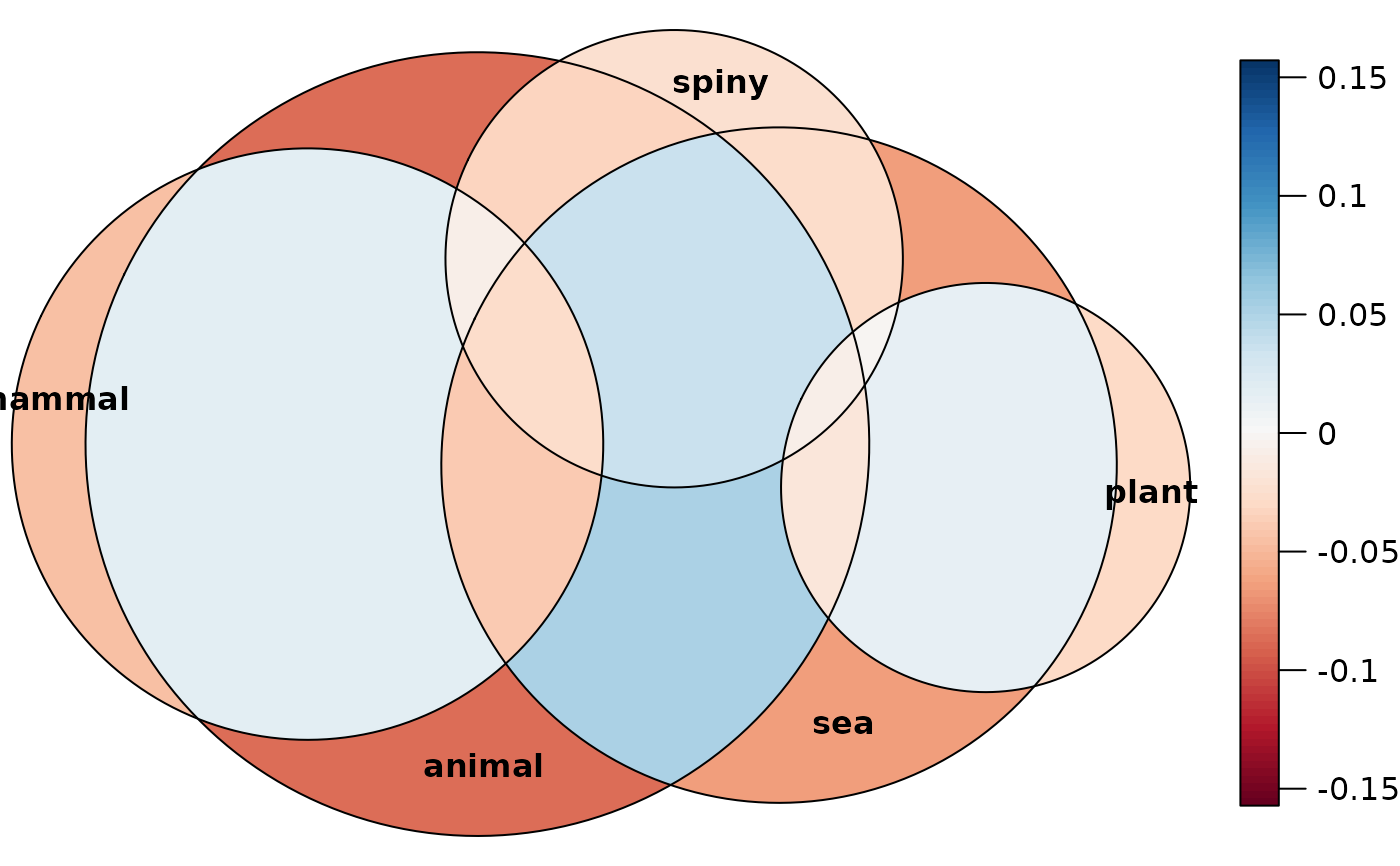
This is a diagnostic tool for evaluating the fit from a call
to euler() visually. A color key is provided by default, which
represents the chosen error metric so that one can easily detect
which areas in the diagram to be skeptical about.
Usage
error_plot(
  x,
  type = c("regionError", "residuals"),
  quantities = TRUE,
  pal = NULL,
  ...
)
Arguments
- x
an object of class
euler, typically the result of a call toeuler().- type
error metric.
'regionError'is the difference in percentage points from the input- quantities
whether to draw the error metric on the plot
- pal
color palette for the fills in the legend
- ...
arguments passed down to
plot.euler(). Currently, providingfills,legend, orstripsare not allowed and will return a warning.
Value
Returns an object of class eulergram, which will be
plotted on the device in the same manner as objects from
plot.euler(). See plot.eulergram() for details.
Details
Notice that this function is purely provided for diagnostic reasons
and does not come with the same kind of customization that
plot.euler() provides: the color legend can only be customized
in regards to its color palette and another key (instead of labels)
is completely turned off.
Examples
error_plot(euler(organisms), quantities = FALSE)