Plot diagrams fit with euler() and venn() using grid::Grid() graphics.
This
function sets up all the necessary plot parameters and computes
the geometry of the diagram. plot.eulergram(), meanwhile,
does the actual plotting of the diagram. Please see the Details section
to learn about the individual settings for each argument.
Usage
# S3 method for class 'euler'
plot(
  x,
  fills = TRUE,
  patterns = FALSE,
  edges = TRUE,
  legend = FALSE,
  labels = identical(legend, FALSE),
  quantities = FALSE,
  annotations = NULL,
  strips = NULL,
  bg = FALSE,
  main = NULL,
  complement = TRUE,
  rotate = 0,
  n = 200L,
  adjust_labels = TRUE,
  ...
)

# S3 method for class 'eulerr_venn'
plot(
  x,
  fills = TRUE,
  patterns = FALSE,
  edges = TRUE,
  legend = FALSE,
  labels = identical(legend, FALSE),
  quantities = TRUE,
  strips = NULL,
  bg = FALSE,
  main = NULL,
  complement = TRUE,
  n = 200L,
  adjust_labels = TRUE,
  ...
)

# S3 method for class 'venn'
plot(...)
Arguments
- x
an object of class
'euler', generated fromeuler()- fills
a logical, vector, or list of graphical parameters for the fills in the diagram. Vectors are assumed to be colors for the fills. See
grid::grid.path(). Named fill vectors can be matched infills$mode = "disjoint"(default) orfills$mode = "union".- patterns
a logical, vector, or list of graphical parameters for fill patterns in the diagram. Vectors are assumed to be pattern types (currently
"stripes"orNA), whereNAmeans no pattern. Supported list items aretype,angle,col,lwd, andalpha. Named pattern vectors can be matched inpatterns$mode = "disjoint"(default) orpatterns$mode = "union".- edges
a logical, vector, or list of graphical parameters for the edges in the diagram. Vectors are assumed to be colors for the edges. See
grid::grid.polyline().- legend
a logical scalar or list. If a list, the item
sidecan be used to set the location of the legend andsymbol_sizecan be used to scale the legend symbols independently of the text size. Seegrid::grid.legend().- labels
a logical, vector, or list. Vectors are assumed to be text for the labels. See
grid::grid.text(). In addition to thegrid::gpar()fields, the following placement controls are supported (delegated to theeunoiaRust crate):labels$placement("raycast"(default),"force_directed", or"elbow") selects the strategy used when a label does not fit inside its region."raycast"and"force_directed"produce straight leader lines (the former places the label along the centroid→POI ray, the latter relaxes labels with a polygon-aware force solver)."elbow"produces d3-pie style orthogonal leaders, stacking exterior labels in left/right columns reached by a three-segment polyline.labels$margin(numeric) overrides the per-region margin between an exterior label and the diagram (default is half the larger of the label's width and height);labels$tether("poi"(default) or"boundary") chooses where the leader line attaches on the source region;labels$gapcontrols the visible gap between the leader tip and the label box edge — a bare numeric is interpreted aslines(font-relative), agrid::unit()is honored as given, and the defaultNULLtrackseulerr_options()$paddingso the gap matches the spacing between label and quantity;labels$leaderis a list (col,alpha,lwd,lty,lex) styling the leader line drawn from the tether to the exterior label. Strategy-specific knobs live in their own sublists:labels$force_directed = list(iterations = ...)sets the iteration cap for the force-directed solver, andlabels$elbow = list(min_gap = ...)sets the minimum vertical centre-to-centre spacing between stacked label boxes in an elbow column.- quantities
a logical, vector, or list. Vectors are assumed to be text for the quantities' labels, which by default are the original values in the input to
euler(). In addition to plain vectors,quantities$labelscan also be a named vector keyed by subset names (e.g.,"A","B","A&B"), which is useful for supplying custom text for overlap regions. Ifquantities$labelsisNULL,quantities$formatcan be used to control number formatting as a list with an itemfun(a function such assignif()orround()) and optional extra arguments passed to that function (for example,list(fun = prettyNum, big.mark = ",")).quantities$totalcan be used to set an external denominator for percent/fraction quantities (instead of the plotted total). to arguments that apply togrid::grid.text(), an argumenttypemay also be used which should be a combination of"counts","percent", and"fraction". The first item will be printed first and the second will be printed thereafter inside brackets. The default istype = "counts". For finer control over the rendered text, setquantities$templateto a string with{counts},{percent}, and/or{fraction}placeholders, for example"{counts}\n{percent}"to put the count and percentage on separate lines or"n={counts} ({percent})"for arbitrary layout. Whentemplateis set it overridestype; the set of placeholders in the template determines which values are computed.- annotations
free-form per-region text rendered as a third stacked element below the quantity (or below the label when no quantity is drawn). Accepts a named character vector keyed by subset name (e.g.
c(A = "n = 12", "A&B" = "n = 3")) as a shorthand forlist(labels = <vector>), or a list withlabelsplusgrid::gpar()fields (col,alpha,fontsize,cex,fontfamily,lineheight,font,rot). Regions absent fromlabelsare not annotated. The composite tag bbox grows to include the annotation, so exterior placement and leader lines adapt automatically. Defaults to slightly smaller text thanlabels/quantities(cex = 0.8).- strips
a list, ignored unless the
'by'argument was used ineuler(). In addition to graphical parameters, this argument can includelabels = list(top = ..., left = ...)for custom strip labels. Unnamed labels are interpreted in display order. Named labels are matched by factor levels and then reordered to display order.- bg
a logical, character, or list controlling the background grob. Character values are interpreted as the background fill color.
- main
a title for the plot in the form of a character, expression, list or something that can be sensibly converted to a label via
grDevices::as.graphicsAnnot(). A list of length one can be provided, in which case its only element is used as the label. If a list of longer length is provided, an item named'label'must be provided (and will be used for the actual text).- complement
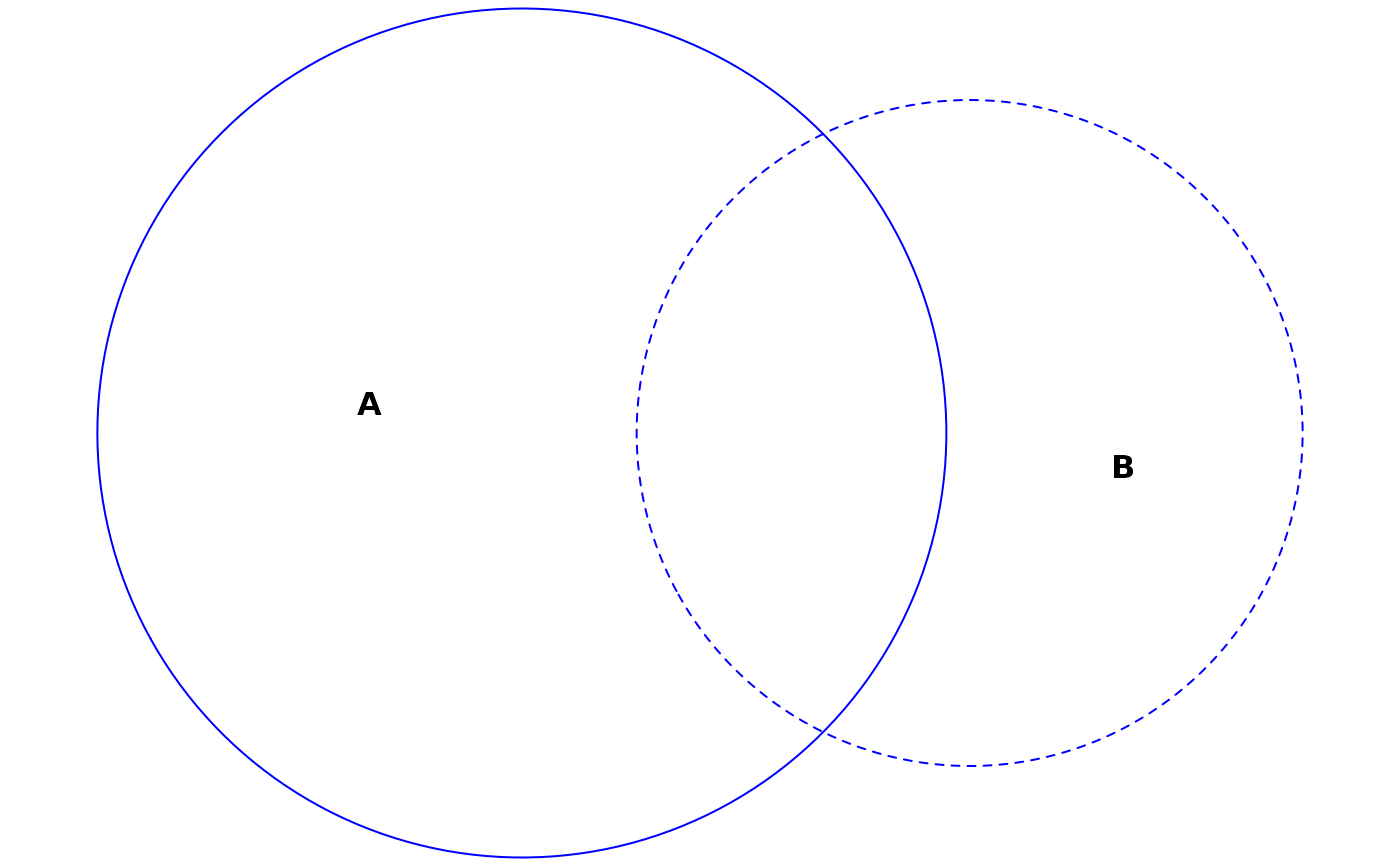
a logical, character, or list controlling the container box and complement region for diagrams fit with
complement =ineuler().TRUE(default) draws the container with a dashed outline (lty = 2), no fill, and the complement count inside the complement region.FALSEsuppresses the container and its label entirely. A character value is treated as a fill color shorthand. A list acceptsfill,alpha,col,lty,lwd,lex(outline + label gpar),fontsize,cex,font,fontfamily,lineheight(label only), andlabel(custom text — defaults to the complement count). Also accepts the same placement controls aslabels(placement,margin,tether,gap,leader,force_directed,elbow) for the complement count label. Has no effect if the diagram was fit withoutcomplement =. Defaults can be set viaeulerr_options(complement = ...).- rotate
a numeric value giving the angle in degrees by which to rotate the entire diagram layout. Positive values rotate counter-clockwise. Defaults to
0(no rotation).- n
number of vertices for the
edgesandfills- adjust_labels
a logical. If
TRUE, adjustment will be made to avoid overlaps or out-of-limits plotting of labels, quantities, and percentages.- ...
parameters to update
fillsandedgeswith and thereby a shortcut to set these parametersgrid::grid.text().
Value
Provides an object of class 'eulergram' , which is a
description of the diagram to be drawn. plot.eulergram() does the actual
drawing of the diagram.
Details
The only difference between plot.euler() and plot.venn() is that
quantities is set to TRUE by default in the latter and FALSE in
the former.
Most of the arguments to this function accept either a logical, a vector, or a list where
logical values set the attribute on or off,
vectors are shortcuts to commonly used options (see the individual parameters), and
lists enable fine-grained control, including graphical parameters as described in
grid::gpar()and control arguments that are specific to each argument.
The various grid::gpar() values that are available for each argument
are:
| fills | edges | labels | quantities | annotations | strips | legend | main | |
| col | x | x | x | x | x | x | x | |
| fill | x | |||||||
| alpha | x | x | x | x | x | x | x | x |
| lty | x | |||||||
| lwd | x | |||||||
| lex | x | |||||||
| fontsize | x | x | x | x | x | x | ||
| cex | x | x | x | x | x | x | ||
| fontfamily | x | x | x | x | x | x | ||
| lineheight | x | x | x | x | x | x | ||
| font | x | x | x | x | x | x |
Defaults for these values, as well as other parameters of the plots, can
be set globally using eulerr_options().
If the diagram has been fit using the data.frame or matrix methods
and using the by argument, the plot area will be split into panels for
each combination of the one to two factors. The fills, patterns, edges,
labels, quantities, and annotations arguments each accept an optional
by_group entry: a named list of override lists keyed by panel name (the
names of the fitted object). For multi-by fits the panel name is the
levels joined by ., e.g. "Male.German". Panels not listed in by_group
use the top-level settings unchanged. Only graphical fields (and rot for
labels, quantities, and annotations) may be overridden per panel;
structural fields such as quantities$type, quantities$format,
annotations$labels, or named-by-subset fills$fill must be set at the
top level.
For users who are looking to plot their diagram using another package, all the necessary parameters can be collected if the result of this function is assigned to a variable (rather than printed to screen).
Examples
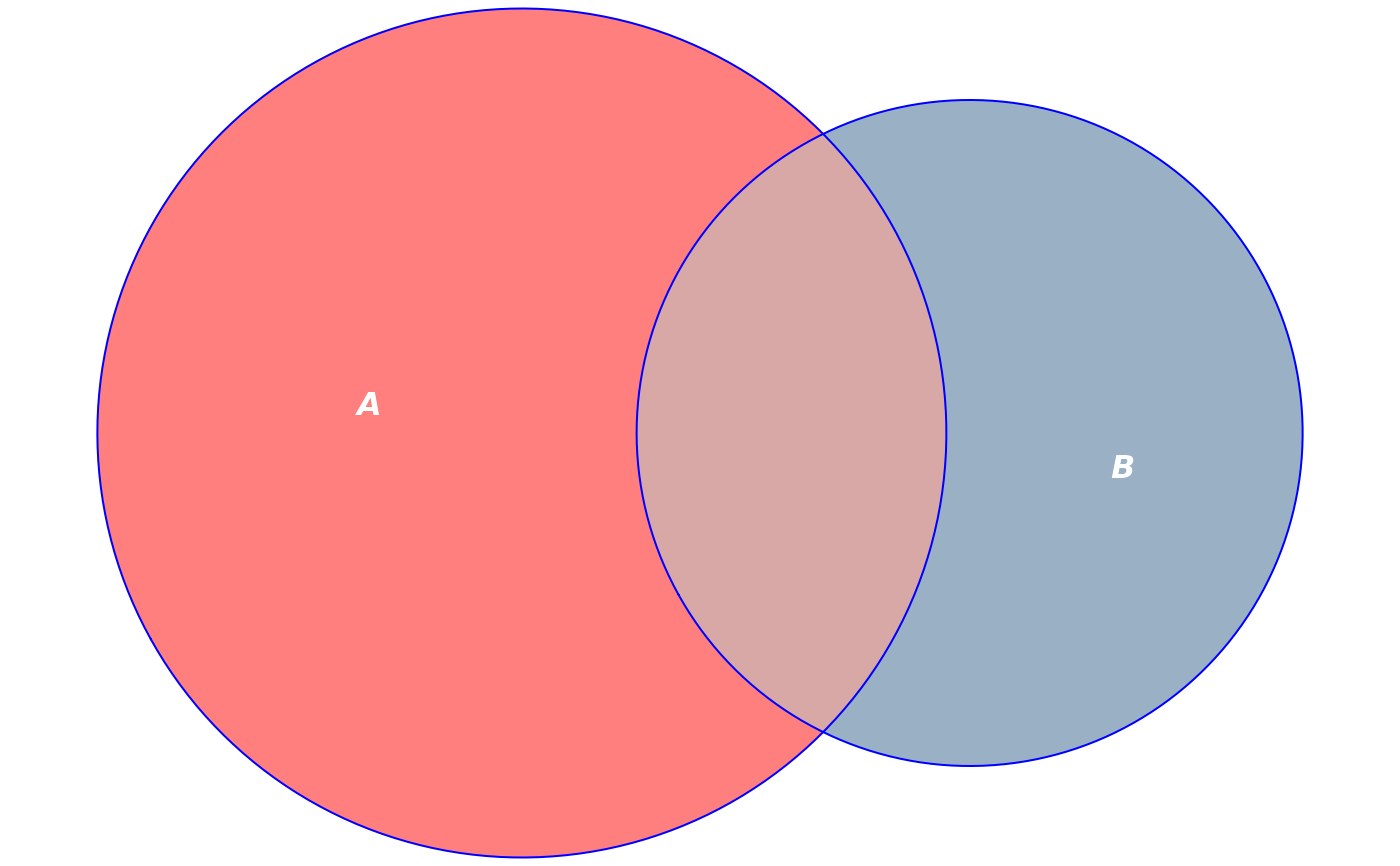
fit <- euler(c("A" = 10, "B" = 5, "A&B" = 3))
# Customize colors, remove borders, bump alpha, color labels white
plot(fit,
fills = list(fill = c("red", "steelblue4"), alpha = 0.5),
labels = list(col = "white", font = 4))
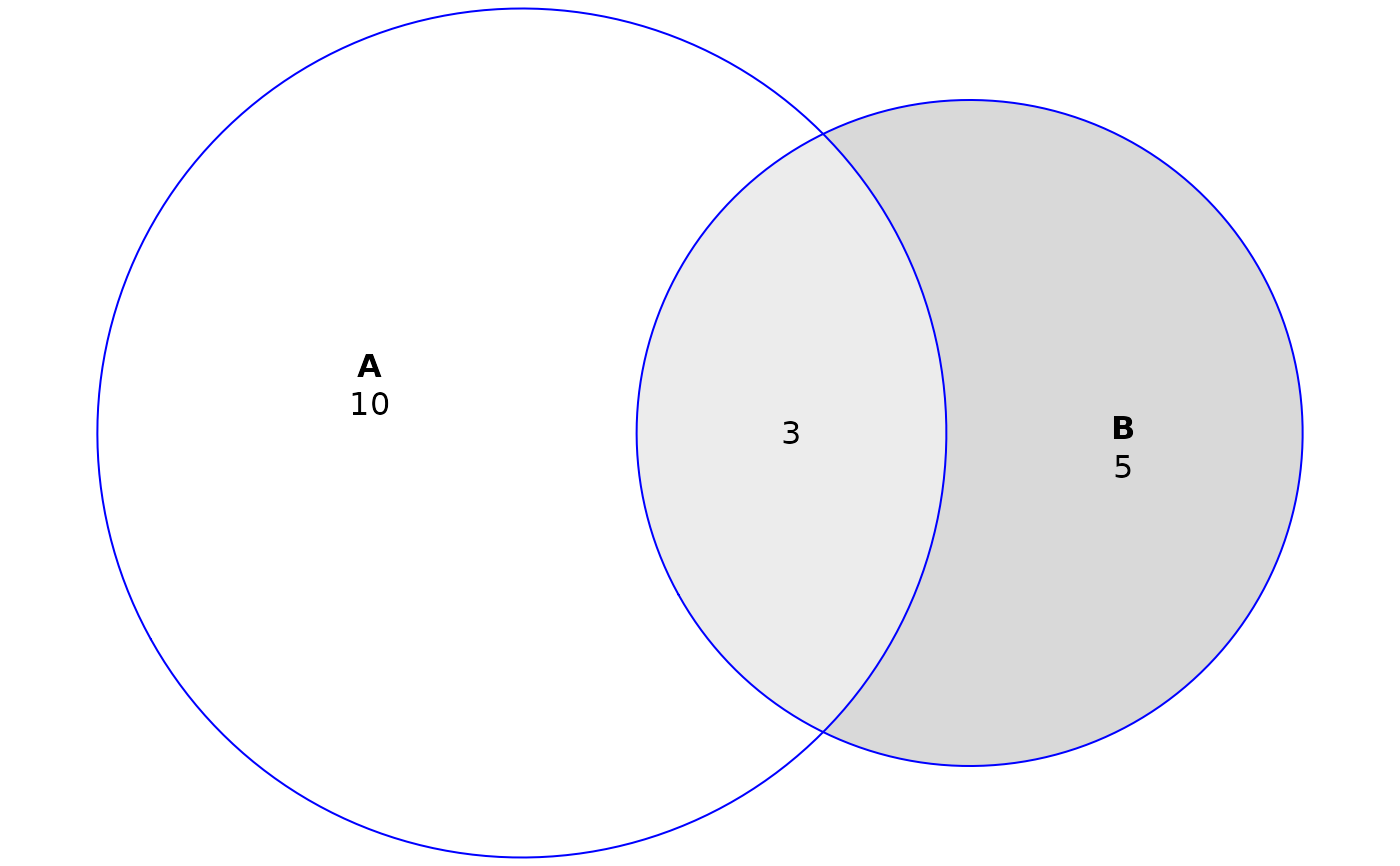
 # Add quantities to the plot
plot(fit, quantities = TRUE)
# Add quantities to the plot
plot(fit, quantities = TRUE)
 # Add free-form per-region annotations below the counts
plot(
fit,
quantities = TRUE,
annotations = c(A = "mean = 35", "A&B" = "mean = 41")
)
# Add free-form per-region annotations below the counts
plot(
fit,
quantities = TRUE,
annotations = c(A = "mean = 35", "A&B" = "mean = 41")
)
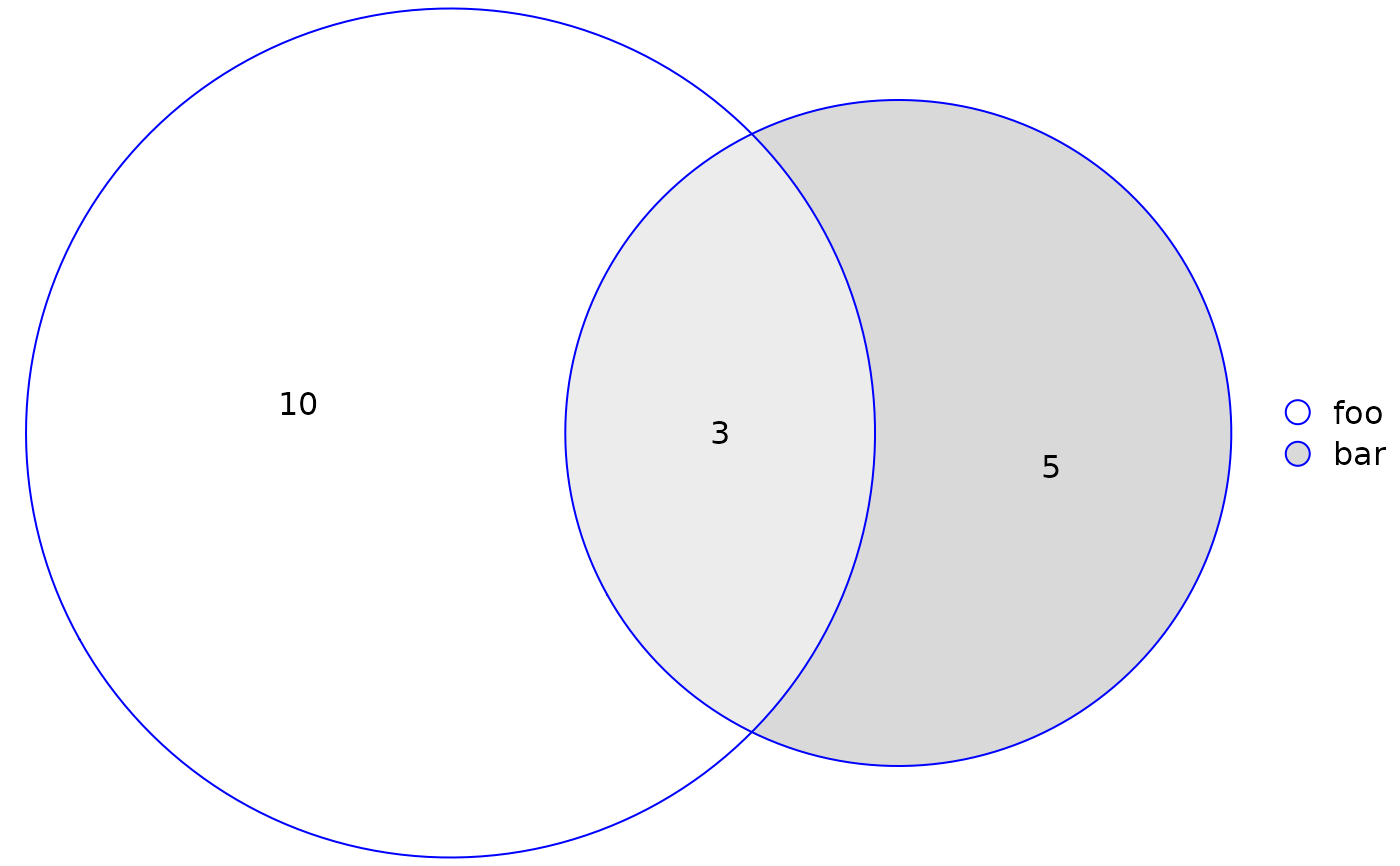 # Add a custom legend and retain quantities
plot(fit, quantities = TRUE, legend = list(labels = c("foo", "bar")))
# Add a custom legend and retain quantities
plot(fit, quantities = TRUE, legend = list(labels = c("foo", "bar")))
 # Plot without fills and distinguish sets with border types instead
plot(fit, fills = "transparent", lty = 1:2)
# Plot without fills and distinguish sets with border types instead
plot(fit, fills = "transparent", lty = 1:2)
 # Save plot parameters to plot using some other method
diagram_description <- plot(fit)
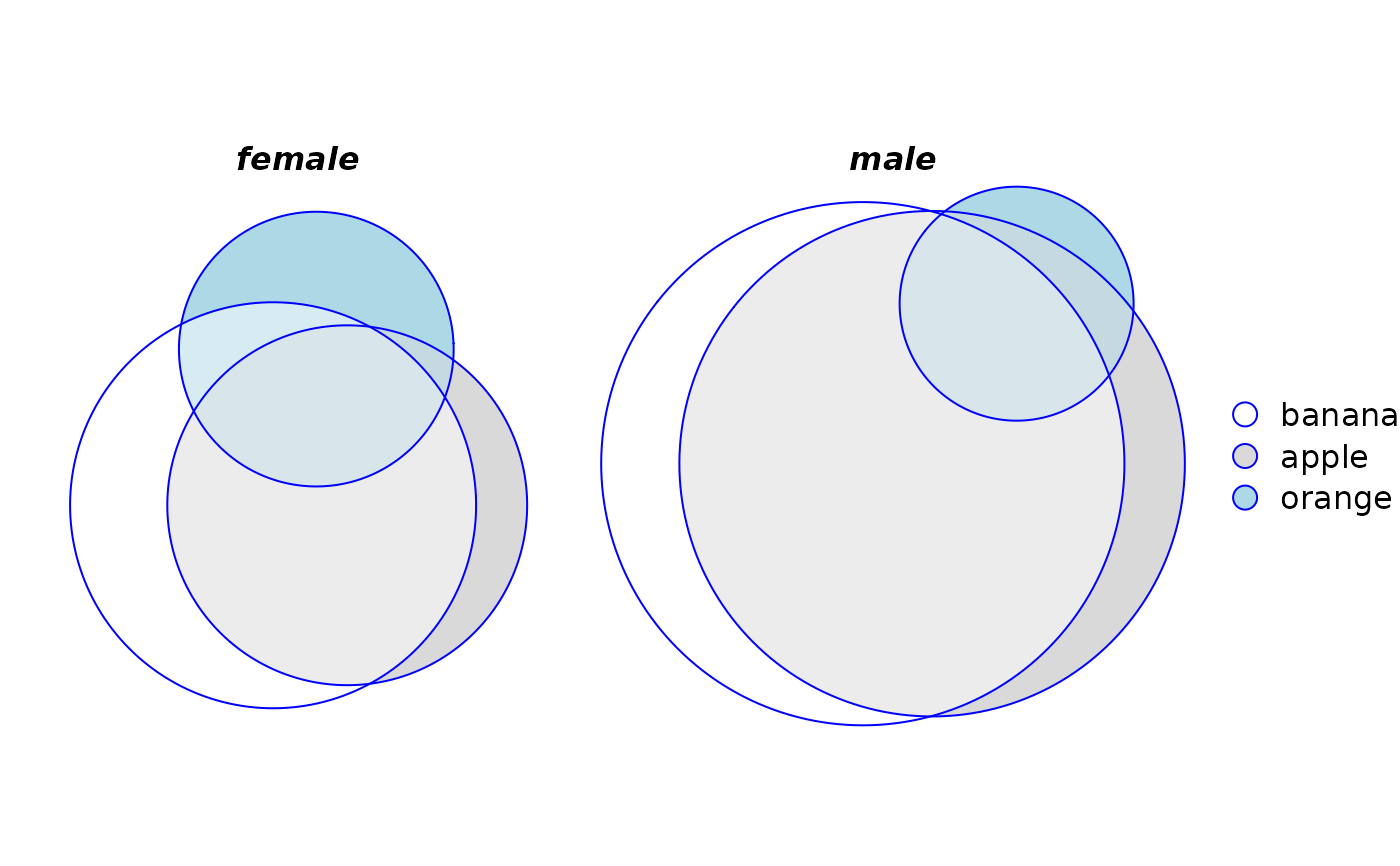
# Plots using 'by' argument
plot(euler(fruits[, 1:4], by = list(sex)), legend = TRUE)
# Save plot parameters to plot using some other method
diagram_description <- plot(fit)
# Plots using 'by' argument
plot(euler(fruits[, 1:4], by = list(sex)), legend = TRUE)
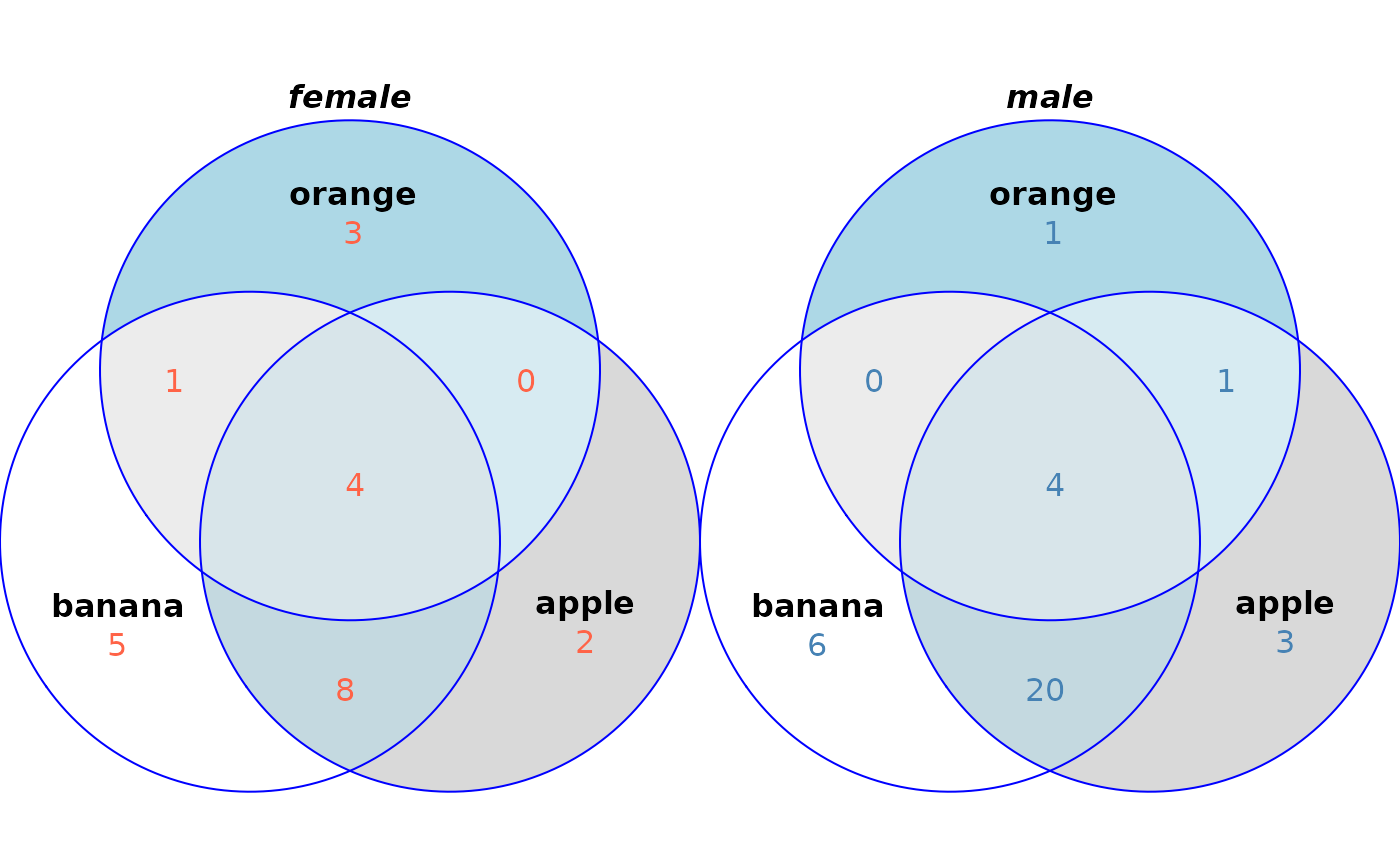
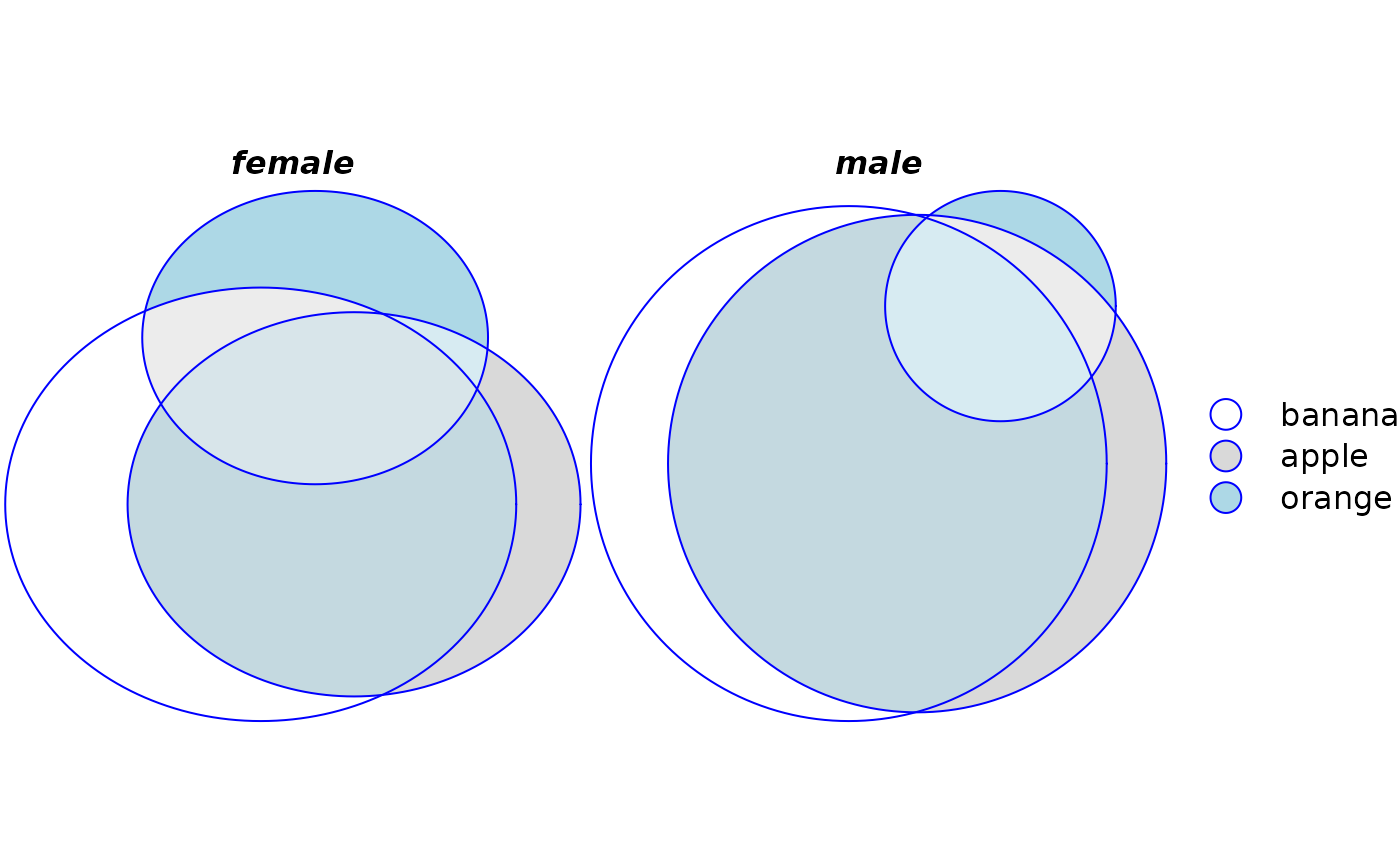 # Per-panel styling with `by_group`
plot(
venn(fruits[, 1:4], by = list(sex)),
quantities = list(
by_group = list(
male = list(col = "steelblue"),
female = list(col = "tomato")
)
)
)
# Per-panel styling with `by_group`
plot(
venn(fruits[, 1:4], by = list(sex)),
quantities = list(
by_group = list(
male = list(col = "steelblue"),
female = list(col = "tomato")
)
)
)