This function fits Venn diagrams using an interface that is
almost identical to euler(). Strictly speaking,
Venn diagrams are Euler diagrams where every intersection is visible,
regardless of whether or not it is zero. In almost every incarnation of
Venn diagrams, however, the areas in the diagram are also
non-proportional to the input; this is also the case here.
Usage
venn(combinations, ...)

# Default S3 method
venn(
  combinations,
  input = c("disjoint", "union"),
  shape = c("ellipse", "rotated_rectangle"),
  names = letters[length(combinations)],
  ...
)

# S3 method for class 'table'
venn(combinations, ...)

# S3 method for class 'data.frame'
venn(
  combinations,
  weights = NULL,
  by = NULL,
  sep = "_",
  factor_names = TRUE,
  ...
)

# S3 method for class 'matrix'
venn(combinations, ...)

# S3 method for class 'list'
venn(combinations, ...)
Arguments
- combinations
set relationships as a named numeric vector, matrix, or data.frame (see methods (by class))
- ...
arguments passed down to other methods
- input
type of input: disjoint identities (
'disjoint') or unions ('union').- shape
geometric shape used in the diagram, either
"ellipse"(the default, supporting up to five sets) or"rotated_rectangle"(supporting up to four sets). Rotated rectangles draw a true four-set Venn diagram in which all 15 regions are visible.- names
a character vector for the names of each set of the same length as 'combinations'. Must not be
NULLifcombinationsis a one-length numeric.- weights
a numeric vector of weights of the same length as the number of rows in
combinations.- by
a factor or character matrix to be used in
base::by()to split the data.frame or matrix of set combinations- sep
a character to use to separate the dummy-coded factors if there are factor or character vectors in 'combinations'.
- factor_names
whether to include factor names when constructing dummy codes
Value
Returns an object of class 'eulerr_venn', 'venn', 'euler' with items
- shapes
a data frame of the precomputed shape parameters (one row per set). For
shape = "ellipse"the columns aretype, h, k, a, b, phi; forshape = "rotated_rectangle"they aretype, h, k, width, height, phi.- ellipses
the legacy 5-column data frame (
h, k, a, b, phi), kept for back-compat alongside the canonicalshapesslot. Only present forshape = "ellipse".- original.values
set relationships in the input
- fitted.values
set relationships in the solution
Methods (by class)
venn(default): a named numeric vector, with combinations separated by an ampersand, for instanceA&B = 10. Missing combinations are treated as being 0.venn(table): A table withmax(dim(x)) < 3.venn(data.frame): adata.frameof logicals, binary integers, or factors.venn(matrix): a matrix that can be converted to a data.frame of logicals (as in the description above) viabase::as.data.frame.matrix().venn(list): a list of vectors, each vector giving the contents of that set (with no duplicates). Vectors in the list do not need to be named.
Examples
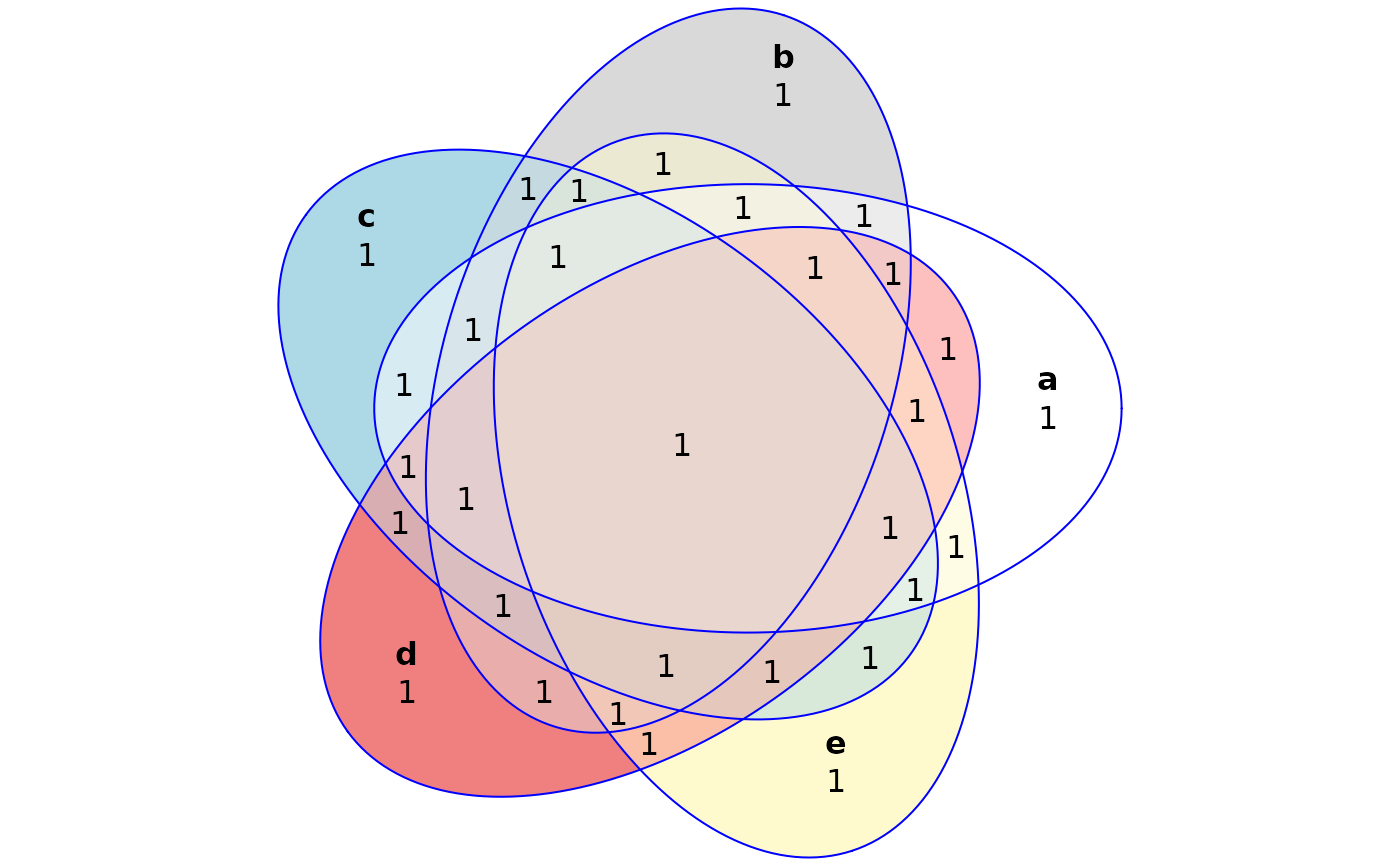
# The trivial version
f1 <- venn(5, names = letters[1:5])
plot(f1)


# Using data (a numeric vector)
f2 <- venn(c(A = 1, "B&C" = 3, "A&D" = 0.3))

# The table method
venn(pain, factor_names = FALSE)
#> 3 set Venn diagram
#>
#>               type     h     k    a    b  phi width height side
#> widespread ellipse -0.42 -0.36 1.05 1.05 3.76    NA     NA   NA
#> regional   ellipse  0.42 -0.36 1.05 1.05 3.76    NA     NA   NA
#> male       ellipse  0.00  0.36 1.05 1.05 3.76    NA     NA   NA

# Using grouping via the 'by' argument through the data.frame method
venn(fruits, by = list(sex, age))
#> female.adult
#> 3 set Venn diagram
#>
#>           type     h     k    a    b  phi width height side
#> banana ellipse -0.42 -0.36 1.05 1.05 3.76    NA     NA   NA
#> apple  ellipse  0.42 -0.36 1.05 1.05 3.76    NA     NA   NA
#> orange ellipse  0.00  0.36 1.05 1.05 3.76    NA     NA   NA
#> ------------------------------------------------------------
#> male.child
#> 3 set Venn diagram
#>
#>           type     h     k    a    b  phi width height side
#> banana ellipse -0.42 -0.36 1.05 1.05 3.76    NA     NA   NA
#> apple  ellipse  0.42 -0.36 1.05 1.05 3.76    NA     NA   NA
#> orange ellipse  0.00  0.36 1.05 1.05 3.76    NA     NA   NA
#> ------------------------------------------------------------
#> male.adult
#> 3 set Venn diagram
#>
#>           type     h     k    a    b  phi width height side
#> banana ellipse -0.42 -0.36 1.05 1.05 3.76    NA     NA   NA
#> apple  ellipse  0.42 -0.36 1.05 1.05 3.76    NA     NA   NA
#> orange ellipse  0.00  0.36 1.05 1.05 3.76    NA     NA   NA
#> ------------------------------------------------------------
#> female.child
#> 3 set Venn diagram
#>
#>           type     h     k    a    b  phi width height side
#> banana ellipse -0.42 -0.36 1.05 1.05 3.76    NA     NA   NA
#> apple  ellipse  0.42 -0.36 1.05 1.05 3.76    NA     NA   NA
#> orange ellipse  0.00  0.36 1.05 1.05 3.76    NA     NA   NA


# Using the matrix method
venn(organisms)
#> 5 set Venn diagram
#>
#>           type      h      k a   b   phi width height side
#> animal ellipse  0.176  0.096 1 0.6 0.000    NA     NA   NA
#> mammal ellipse -0.037  0.197 1 0.6 1.257    NA     NA   NA
#> plant  ellipse -0.198  0.026 1 0.6 2.513    NA     NA   NA
#> sea    ellipse -0.086 -0.181 1 0.6 3.770    NA     NA   NA
#> spiny  ellipse  0.145 -0.137 1 0.6 5.027    NA     NA   NA

# Using weights
venn(organisms, weights = c(10, 20, 5, 4, 8, 9, 2))
#> 5 set Venn diagram
#>
#>           type      h      k a   b   phi width height side
#> animal ellipse  0.176  0.096 1 0.6 0.000    NA     NA   NA
#> mammal ellipse -0.037  0.197 1 0.6 1.257    NA     NA   NA
#> plant  ellipse -0.198  0.026 1 0.6 2.513    NA     NA   NA
#> sea    ellipse -0.086 -0.181 1 0.6 3.770    NA     NA   NA
#> spiny  ellipse  0.145 -0.137 1 0.6 5.027    NA     NA   NA

# A venn diagram from a list of sample spaces (the list method)
venn(plants[c("erigenia", "solanum", "cynodon")])
#> 3 set Venn diagram
#>
#>             type     h     k    a    b  phi width height side
#> erigenia ellipse -0.42 -0.36 1.05 1.05 3.76    NA     NA   NA
#> solanum  ellipse  0.42 -0.36 1.05 1.05 3.76    NA     NA   NA
#> cynodon  ellipse  0.00  0.36 1.05 1.05 3.76    NA     NA   NA
# Using data (a numeric vector)
f2 <- venn(c(A = 1, "B&C" = 3, "A&D" = 0.3))
# The table method
venn(pain, factor_names = FALSE)
#> 3 set Venn diagram
#>
#> type h k a b phi width height side
#> widespread ellipse -0.42 -0.36 1.05 1.05 3.76 NA NA NA
#> regional ellipse 0.42 -0.36 1.05 1.05 3.76 NA NA NA
#> male ellipse 0.00 0.36 1.05 1.05 3.76 NA NA NA
# Using grouping via the 'by' argument through the data.frame method
venn(fruits, by = list(sex, age))
#> female.adult
#> 3 set Venn diagram
#>
#> type h k a b phi width height side
#> banana ellipse -0.42 -0.36 1.05 1.05 3.76 NA NA NA
#> apple ellipse 0.42 -0.36 1.05 1.05 3.76 NA NA NA
#> orange ellipse 0.00 0.36 1.05 1.05 3.76 NA NA NA
#> ------------------------------------------------------------
#> male.child
#> 3 set Venn diagram
#>
#> type h k a b phi width height side
#> banana ellipse -0.42 -0.36 1.05 1.05 3.76 NA NA NA
#> apple ellipse 0.42 -0.36 1.05 1.05 3.76 NA NA NA
#> orange ellipse 0.00 0.36 1.05 1.05 3.76 NA NA NA
#> ------------------------------------------------------------
#> male.adult
#> 3 set Venn diagram
#>
#> type h k a b phi width height side
#> banana ellipse -0.42 -0.36 1.05 1.05 3.76 NA NA NA
#> apple ellipse 0.42 -0.36 1.05 1.05 3.76 NA NA NA
#> orange ellipse 0.00 0.36 1.05 1.05 3.76 NA NA NA
#> ------------------------------------------------------------
#> female.child
#> 3 set Venn diagram
#>
#> type h k a b phi width height side
#> banana ellipse -0.42 -0.36 1.05 1.05 3.76 NA NA NA
#> apple ellipse 0.42 -0.36 1.05 1.05 3.76 NA NA NA
#> orange ellipse 0.00 0.36 1.05 1.05 3.76 NA NA NA
# Using the matrix method
venn(organisms)
#> 5 set Venn diagram
#>
#> type h k a b phi width height side
#> animal ellipse 0.176 0.096 1 0.6 0.000 NA NA NA
#> mammal ellipse -0.037 0.197 1 0.6 1.257 NA NA NA
#> plant ellipse -0.198 0.026 1 0.6 2.513 NA NA NA
#> sea ellipse -0.086 -0.181 1 0.6 3.770 NA NA NA
#> spiny ellipse 0.145 -0.137 1 0.6 5.027 NA NA NA
# Using weights
venn(organisms, weights = c(10, 20, 5, 4, 8, 9, 2))
#> 5 set Venn diagram
#>
#> type h k a b phi width height side
#> animal ellipse 0.176 0.096 1 0.6 0.000 NA NA NA
#> mammal ellipse -0.037 0.197 1 0.6 1.257 NA NA NA
#> plant ellipse -0.198 0.026 1 0.6 2.513 NA NA NA
#> sea ellipse -0.086 -0.181 1 0.6 3.770 NA NA NA
#> spiny ellipse 0.145 -0.137 1 0.6 5.027 NA NA NA
# A venn diagram from a list of sample spaces (the list method)
venn(plants[c("erigenia", "solanum", "cynodon")])
#> 3 set Venn diagram
#>
#> type h k a b phi width height side
#> erigenia ellipse -0.42 -0.36 1.05 1.05 3.76 NA NA NA
#> solanum ellipse 0.42 -0.36 1.05 1.05 3.76 NA NA NA
#> cynodon ellipse 0.00 0.36 1.05 1.05 3.76 NA NA NA